RIMC, short for range, initiation, mitigation and continuation. It is a very common oderflow pattern. Most commonly also known as a break and retest. They are the same thing in general but most people who call it break and retest just see price go up and down, they don’t actually understand what’s happening. People who trade SMC or oderflow should have a very good understanding of the theory behind why price behaves and reacts the way it does to form this pattern. If you don’t, keep reading as I will break it down and explain every process that takes place while this pattern is forming.
Just like with all my other articles I will use one set up as an example, in this case a bullish RIMC set up. It is just the opposite if you spot a bearish set up.
Range
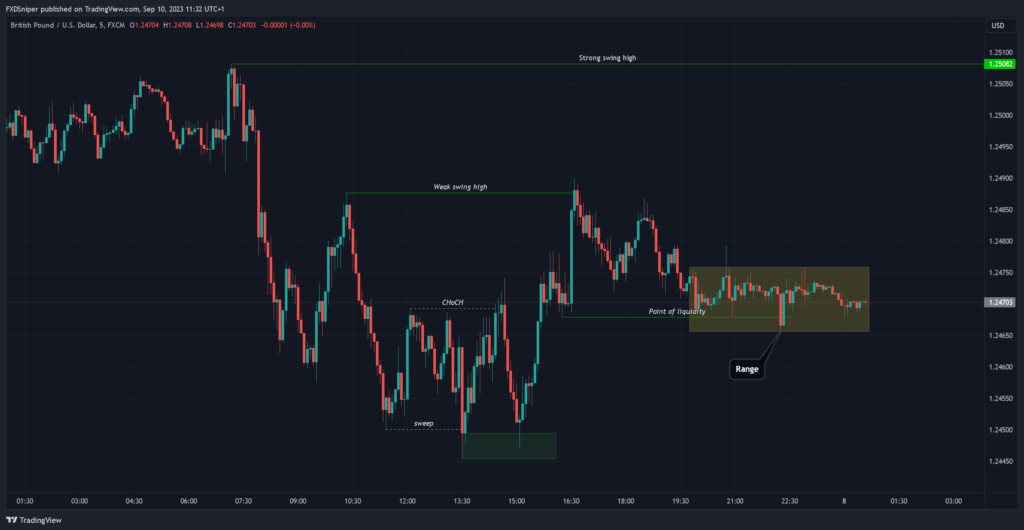
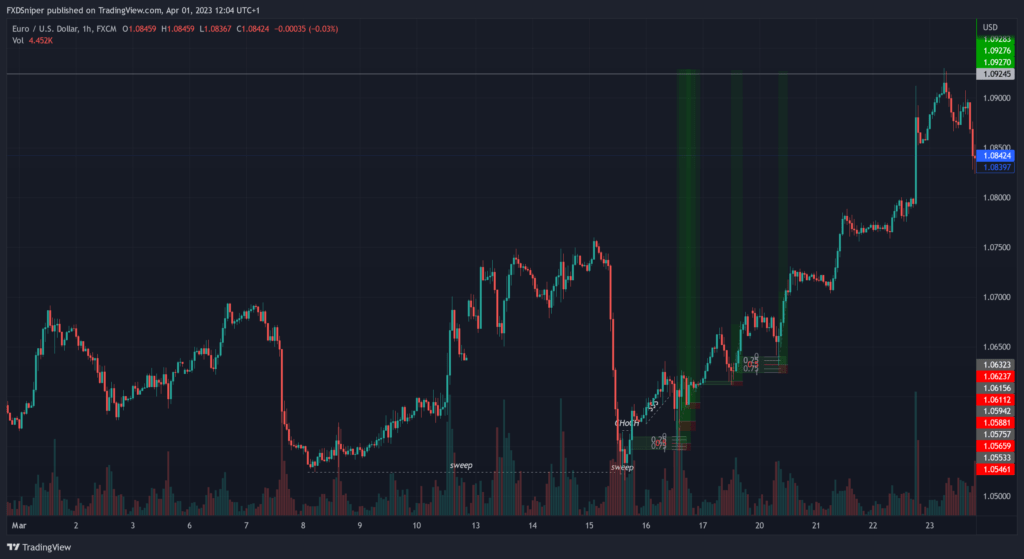
Before we even get to our range, you have to know which way the price is trending. We can tell it is bullish because the previous structure tells us. GU was bearish for a while, it had a final sweep of the low and moved up changing character, the price then came down into the latest demand zone and made a strong push to the upside breaking all internal structure. This without a doubt indicates the price is bullish. I already have a bunch of articles that go into detail about ChoCh, sweeps and structure so if you have trouble understanding this chart, make sure to read them as well.
Our members already secured 7-figures in funding capital. Join the FXD Academy and take your trading to the next level, click here to learn more.
It is a natural price behavior that when a point of structure is broken there is a period of retracement/consolidation. That’s why after we broke the internal high, the price slowed down and started heading down. We see the range is starting to form near the previous point of structure which means there’s liquidity below which also means the price has to sweep the liquidity to continue its bullish move. And it does happen followed by more consolidation, this alone indicates that there’s not enough bearish pressure to push the price lower and the market makers are accumulating more buy orders.
Initiation
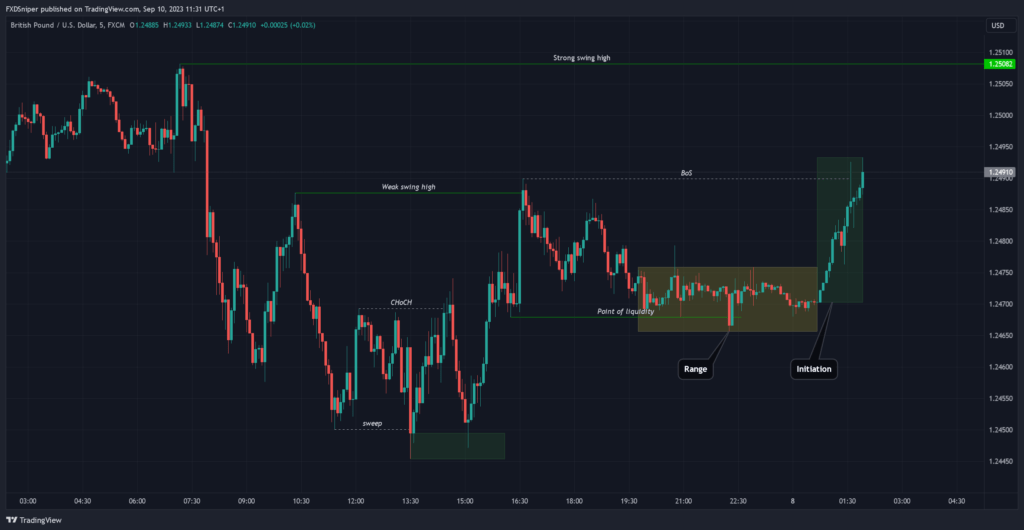
The initiation phase of this pattern is simply the breakout of the range. After the market makers accumulated enough buy positions they are ready to start pushing the price in their desired direction.
In order for the initiation phase to be valid you want it to be at least the same size as the range, otherwise it may be considered a sweep of liquidity. It’s not required but ideally you also want the initiation move to break a major point of structure. In this case we broke above the previous high which invalidated all internal structure. This gives us a strong confirmation that the price is ready to break our strong high. All you have to do now is wait for the price to come back into our range and take your entry.
Mitigation
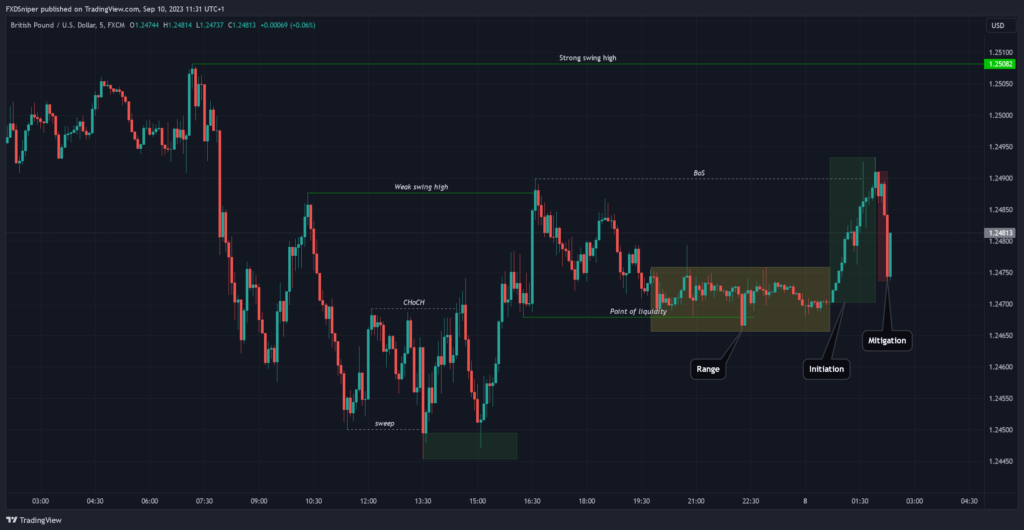
We have our bias, we have our confirmation. Now all you have to do is wait for the price to mitigate the range it has broken out of. Usually the mitigated phase of our RIMC pattern is a strong move in the opposite direction potentially trapping and liquidating other traders which may also confuse more traders into thinking the trend is reversing.
Become a VIP and get access to exclusive insights, powerful trading indicators and other resources, click here to join now.
You can either enter your trade as soon as the price comes back into the range with a stop loss below (the safe option) or you can watch the 1 minute timeframe and wait for a confirmation or a signal to enter with a much smaller stop loss (the risky option). In my experience the mitigation move happens very fast and often leaves no time or signal for entry that’s why I prefer the safe option, however there are some exceptions which depend on the time of day and high volatility, that’s when finding entries on a smaller timeframe may work out better.
Continuation
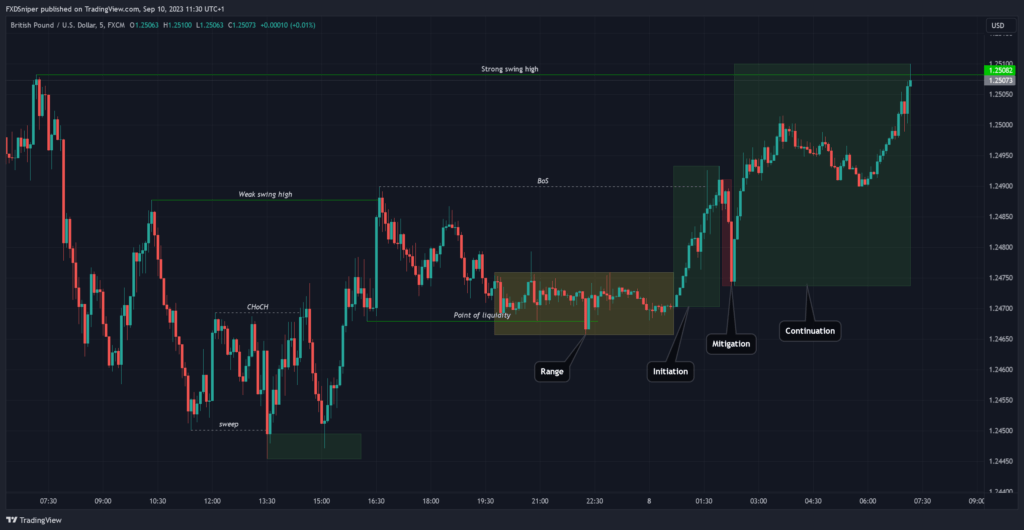
Notice the sudden change in bias as soon as the price entered our range zone. This is a very strong confirmation that the market makers are bullish and are very likely to break the next major point in structure and that’s where you should take most if not all profit. In this case, our strong swing high, which is the last major high which caused the price to become bearish.
Also notice this whole setup was analysed on a 5 minute timeframe. This orderflow pattern works very well for intra day traders using 5-15 minute timeframes. Although it still works well on higher timeframes, it becomes much harder to identify and there may be a lot more noise in between, that’s why ideally you want to trade this pattern as an intra day strategy.
Leading broker 16+ years in the industry
Spreads starting from 0.0 pips
Up to 1:2000 leverage
Trade Forex, Futures, Stocks and Commodities
Instant withdrawals get paid in under a minute
To Summaraise
- RIMC is an advanced way to analyse the break and retest pattern.
- The price must have a significant break above the range in order to be valid.
- Enter the trade only during the mitigation phase as soon as price comes back into the range and take profit at the next major point of structure.
- This setup works best as a intra day strategy on 5-15 minute timeframes.