Supply and demand trading is the number one and most important trading strategy when it comes to naked chart trading. You can’t trade price action properly without knowing your supply and demand zones. You can’t trade support and resistance properly without knowing your supply and demand zones. If you can somehow you’re significantly reducing your potential as a trader.
In this article I will break down how I identify s&d zones and show you step by step how to refine your zones the SMC way. Let’s start from the basics.
What is Supply and Demand in trading?
In the world of economics, the concept of supply and demand is the driving force behind any market or any business. Without sufficient supply of an item in the market and high demand, the business owners are forced to increase the prices to lower the demand. If the supply of an item is much higher than the demand, the business owners must lower their prices to compete in the market.
On the other hand if the supply and demand of an item are on the same level, everybody is satisfied and the price stays the same.
So how does that apply to trading?
Well, the principles are exactly the same, only on a much larger scale. If a country is not doing so well, maybe it’s in a recession, other countries would not be interested in buying that currency and its price will go down.
That’s what’s happening with the US dollar right now. The US is in a recession, interest rates are rising, its GDP isn’t growing as expected and the country is not doing so well overall (Biden…). All of these factors (and much more which I didn’t mention) lower the demand for the US dollar, that’s why the dollar index (DXY) dropped more than 12% from its highs last year. Whereas other pairs such as GBP, AUD or JPY have gone up, because governments and investors are moving their money from the USD into other currencies.
Okay, let’s skip the boring part and get into the technicals now.
How to identify Supply and Demand zones?
There’s multiple way to start which depend on your own trading style. I always start to draw my zones on the 4h chart, you can start on the daily or the weekly but that’s just not my style, the concept is still the same so you can apply this to any timeframe.
Become a VIP and get access to exclusive insights, powerful trading indicators and other resources, click here to join now.
The most basic way to identify a zone is to mark your zone from the next candle that broke structure to the low/high of the current move. This is what it looks like on the chart:
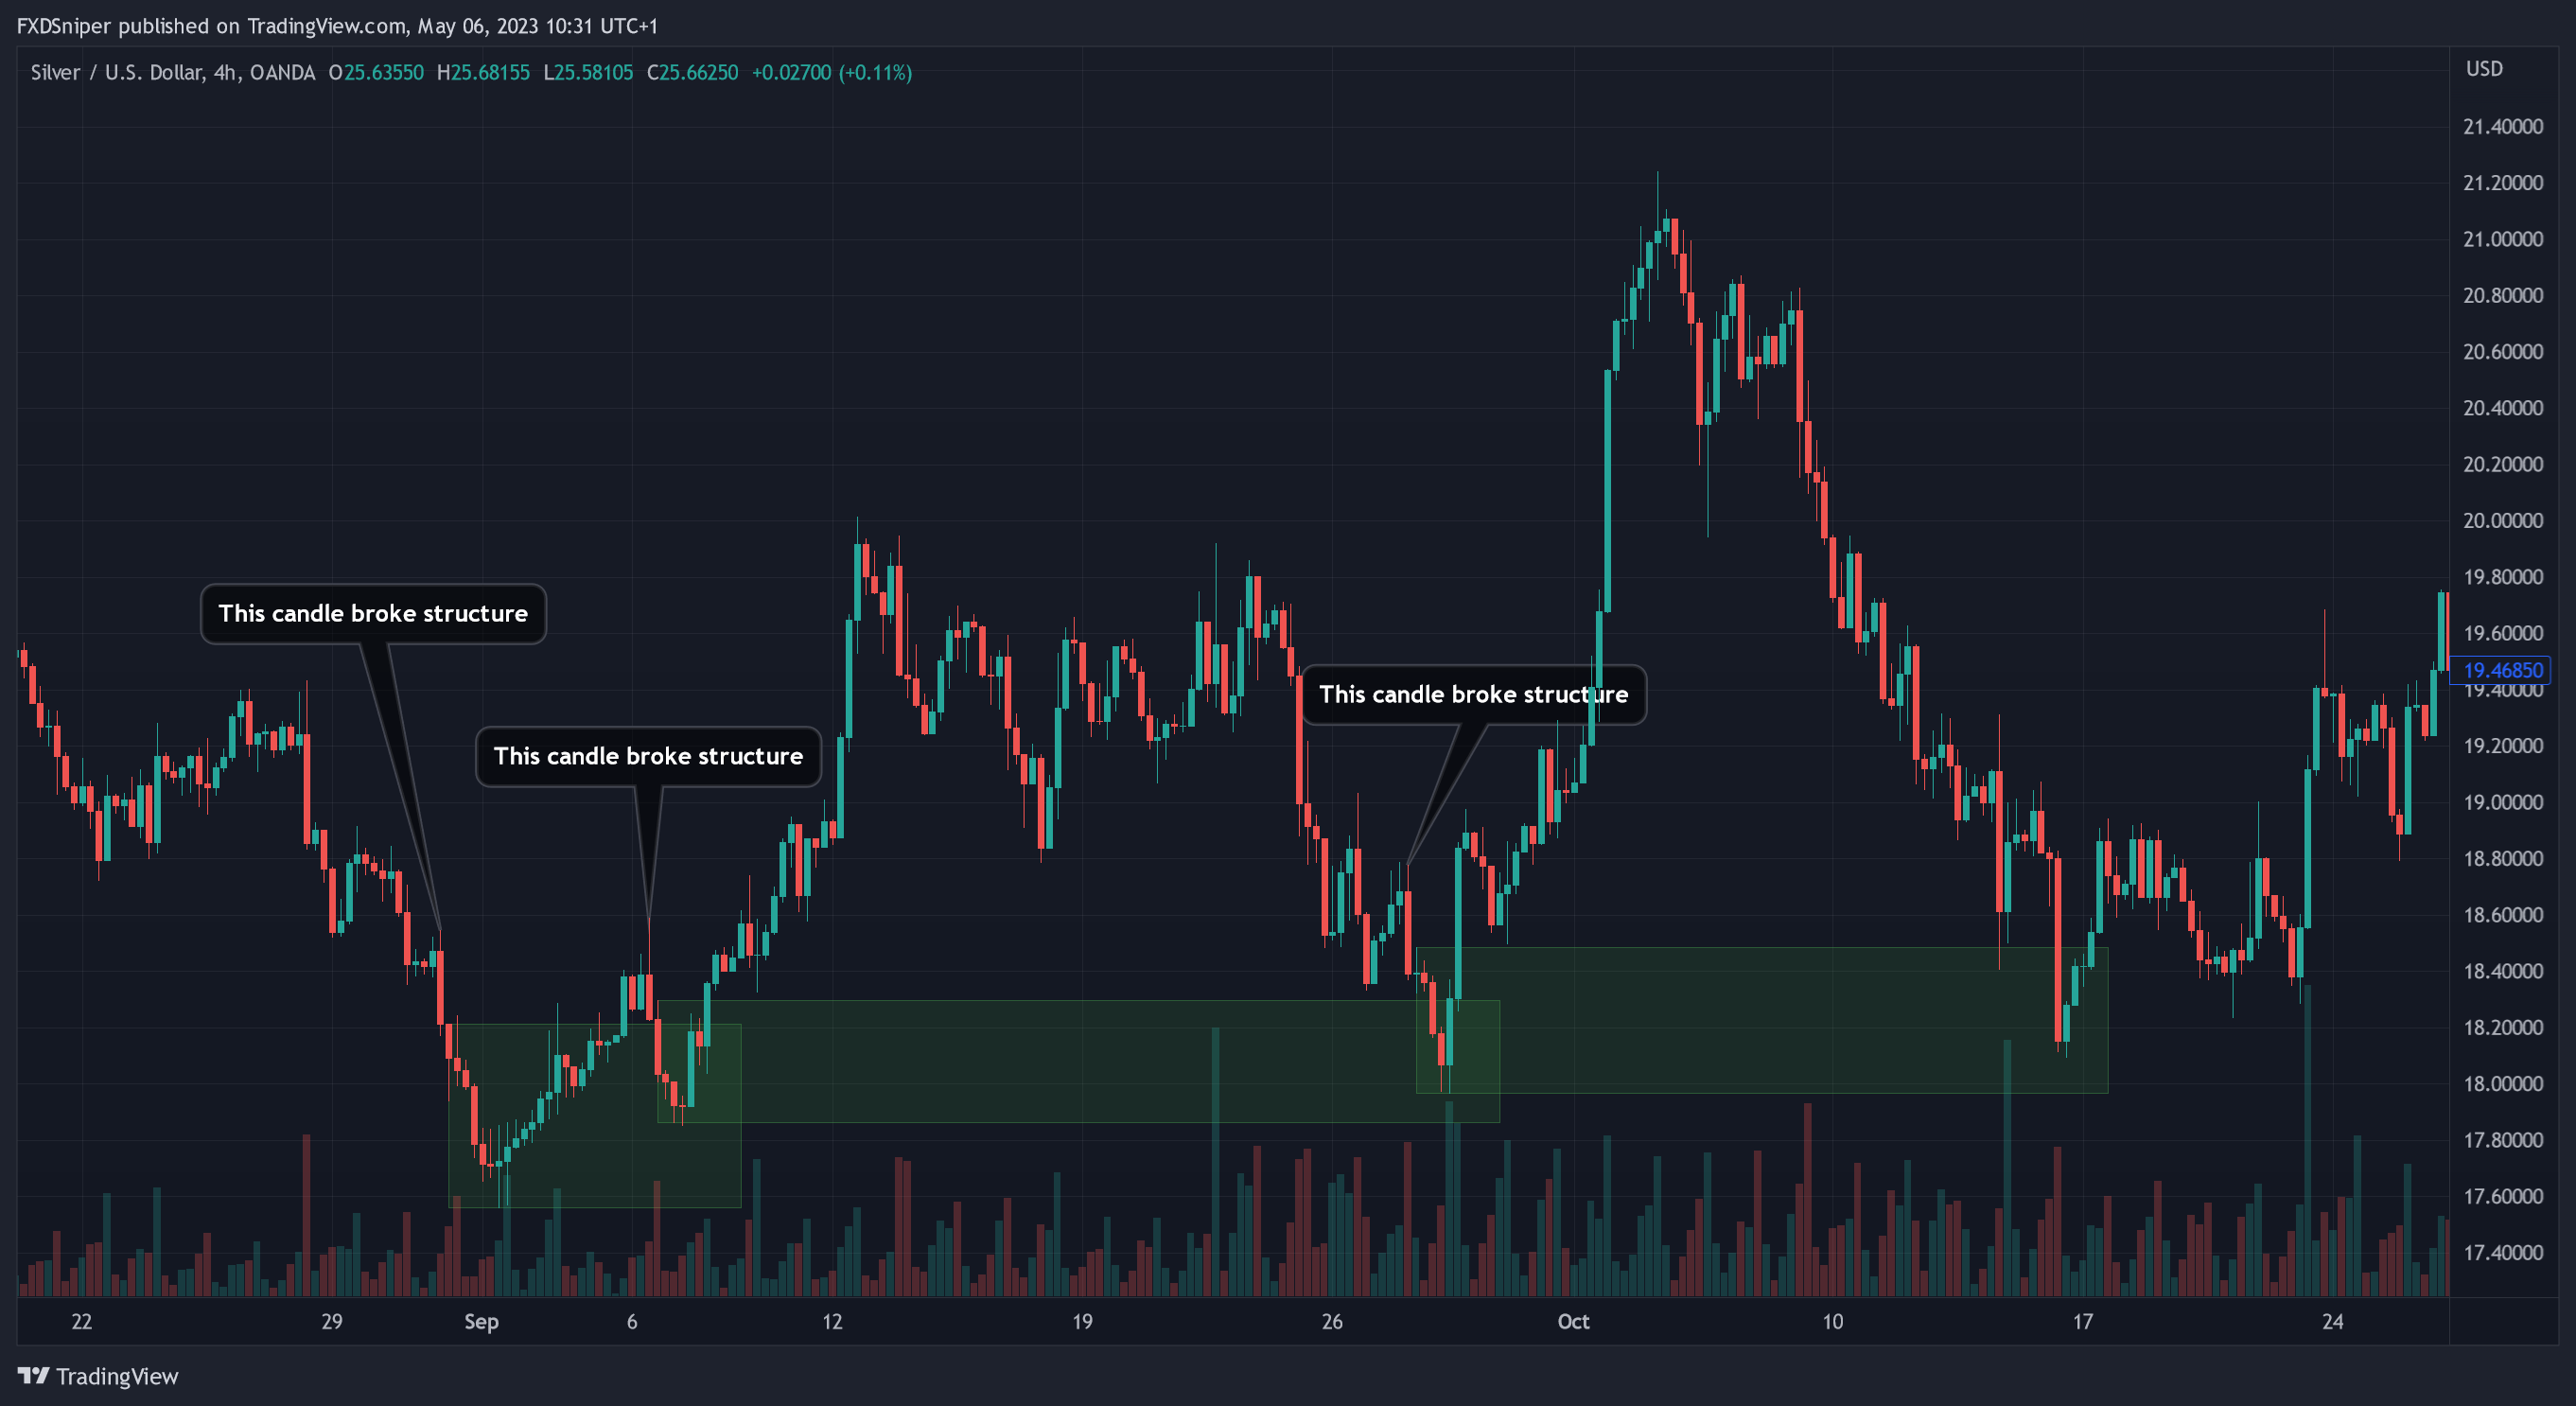
Silver is in an uptrend so obviously we’re only looking at demand zones here but it would work the same way if we flipped the chart upside down and marked the supply zones. As you can see every time price came back into the zone it reversed, however the zones are very big and would require a large stop loss to enter the trade. But if you’re a swing trader and you want high probability trades this is definitely the way to go. This is not the SMC way and it’s not my way of marking out the zones.
This is my way:
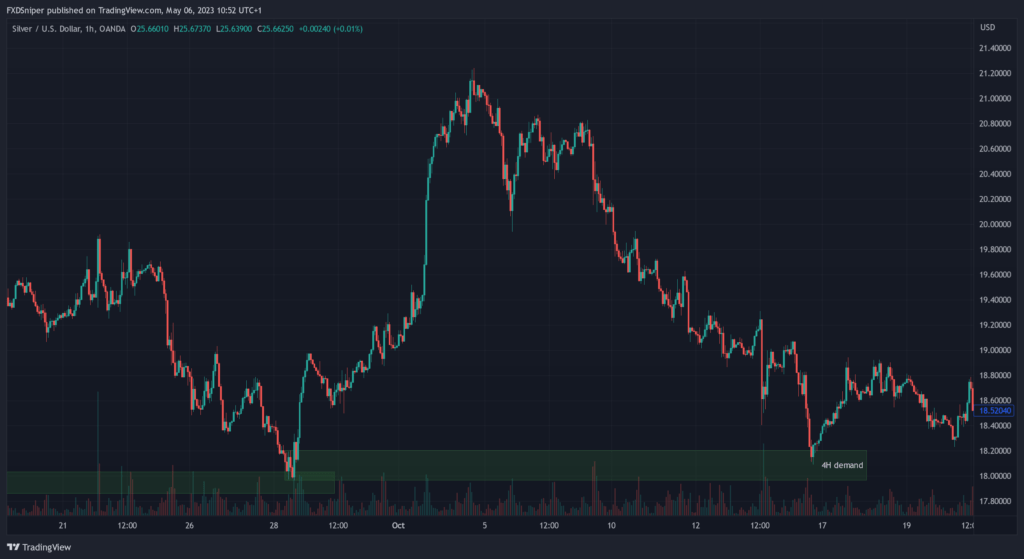
My way of identifying my zones is to mark the zone on the last candle before the price reverses. If the last candle is very small and it was followed by other smaller candles which means consolidation I would use those candles too (2nd zone).
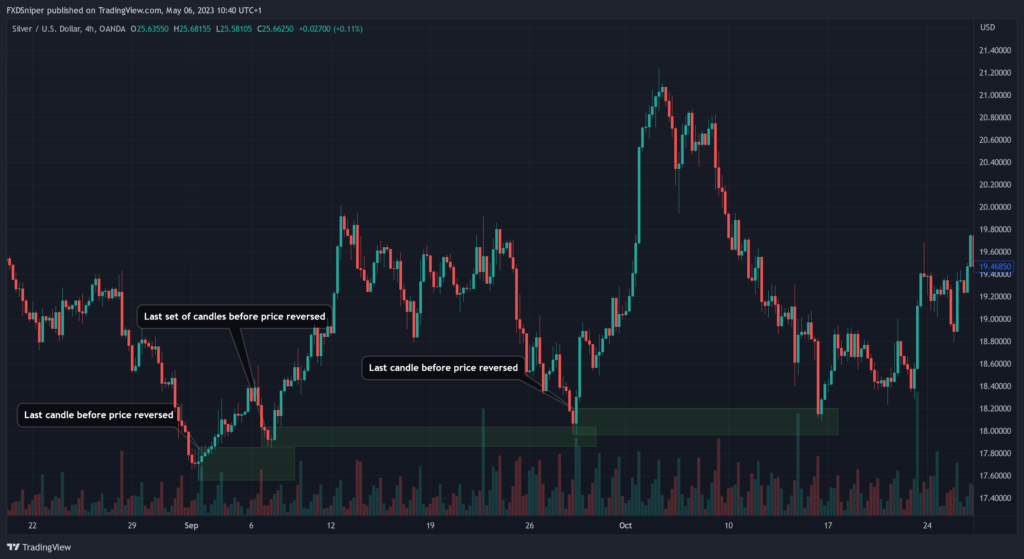
You can clearly see the difference, the zones are much smaller and much more precise here. But we’re not done here, we can get the zones even more precise. Let’s look at the same chart on the 1h timeframe.
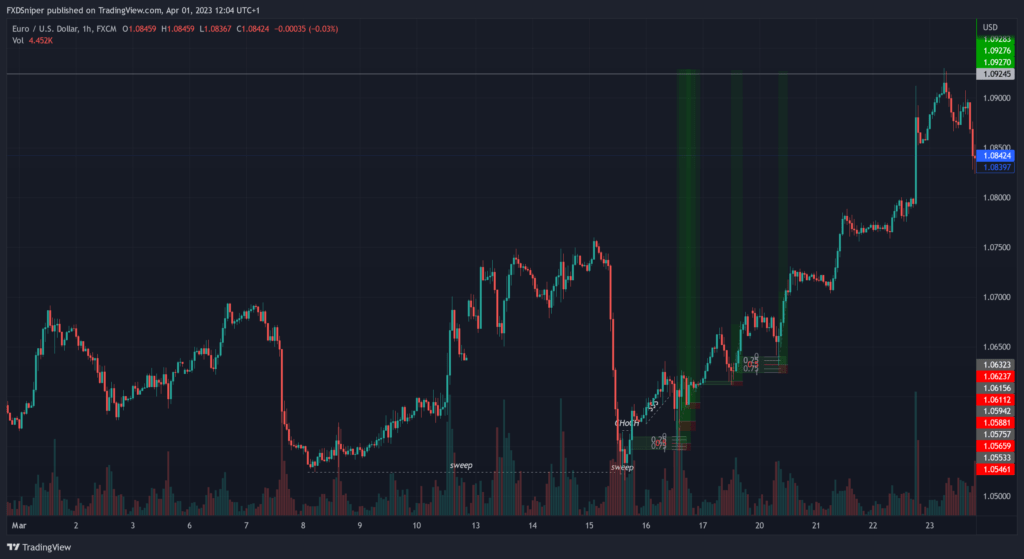
You can clearly see there’s a lot of room for improvement there. There is also an SMC trap at our current zone.
Let me show you the refined zone.
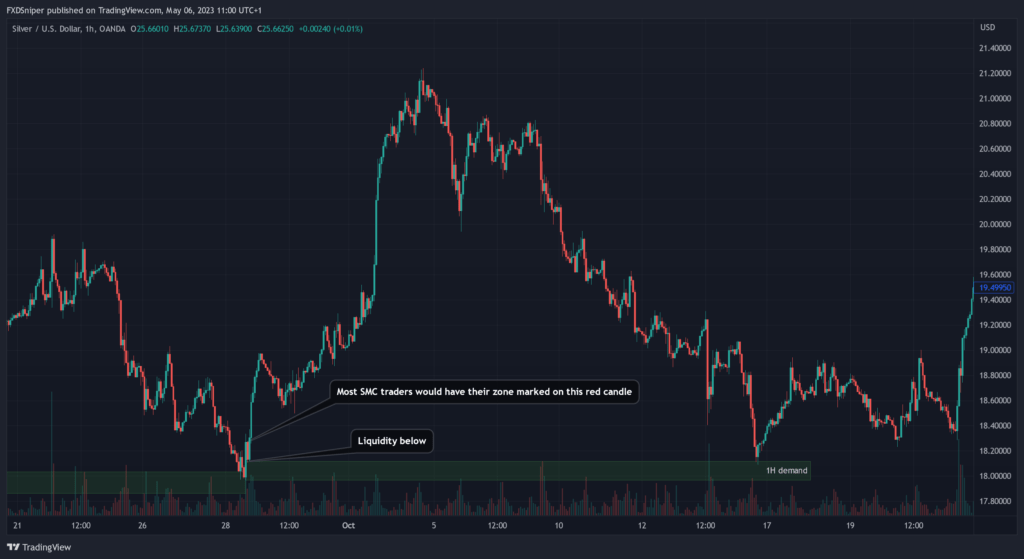
If you’ve been studying SMC concepts before you know 99% of SMC would have their zone marked on the red candle because that’s what they would call an “orderblock” and most of SMC concepts tell you to enter trades at the orderblock. Wrong! That’s why they lose just like most other retail traders do.
Our members already secured 7-figures in funding capital. Join the FXD Academy and take your trading to the next level, click here to learn more.
That’s why I mark my zone from the low to the orderblock because there’s liquidity below. I call these the “high liquidity zones” and as you can see price just tapped into the zone and revered liquidating most of the SMC traders.
If your zone is still too big you can keep doing this and going down in timeframe to refine your zones even more. But in this example I would be more than happy to take this trade as it is.
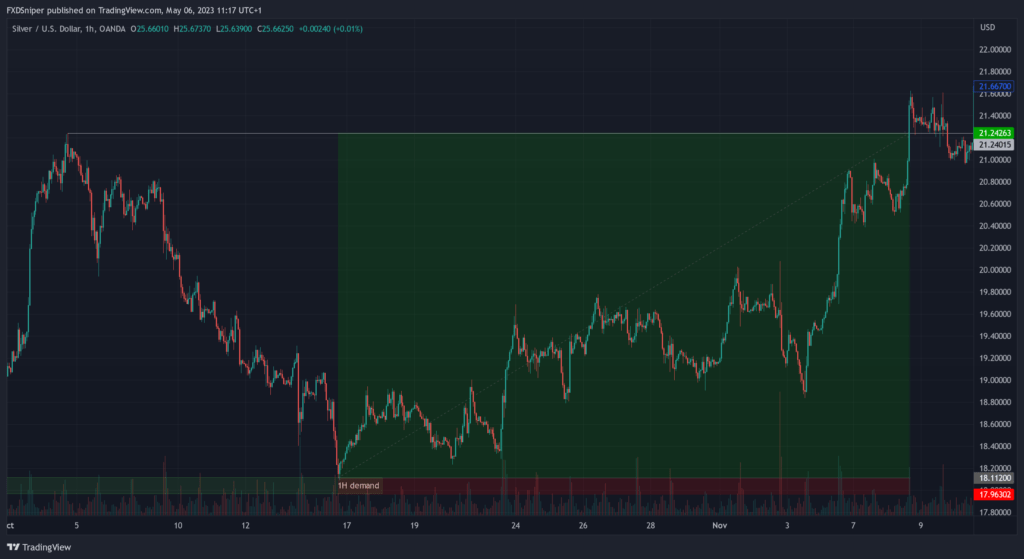
This is what the trade would have looked like if you did take it. Your 1st target would have been the last high for a beautiful 1:21 risk to reward. And 1 1:40 RR for TP2 if you’re a long term trader.
How to identify the correct zones?
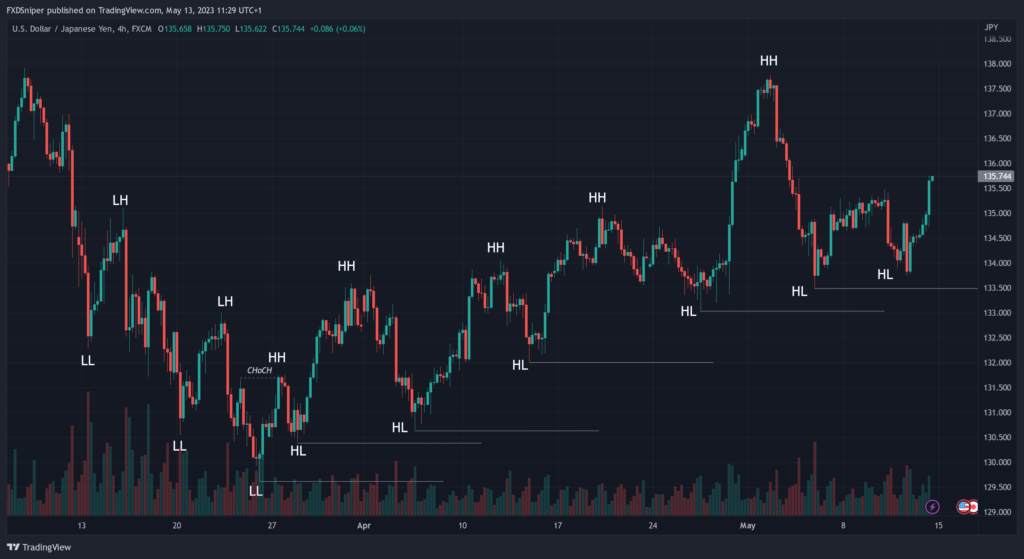
There are multiple ways to identify the correct zones, however my most commonly used confirmation is a break of structure. For example if price is moving up and we get a structure break to the downside it validates your supply zone.
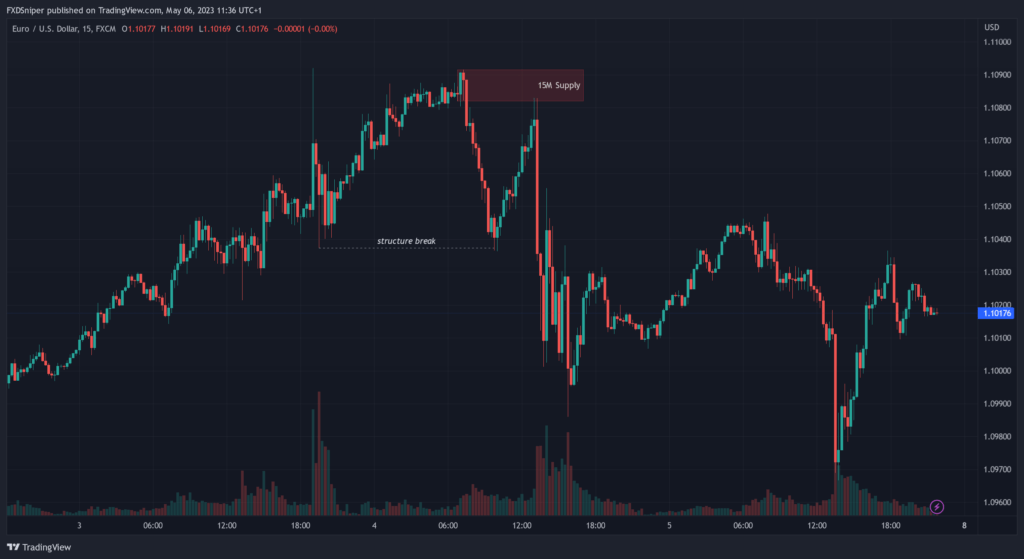
See price was moving up, you could have tried to draw a supply zone at any point but it would make sense. As soon as price came down and broke structure we draw the zone from the “last candle before reversal” and that’s your valid supply zone. Price then only taps into the zone and continues to push lower.
Let me show you one more example of refining a valid s&d zone with a trade example to show you how the risk to reward changes.
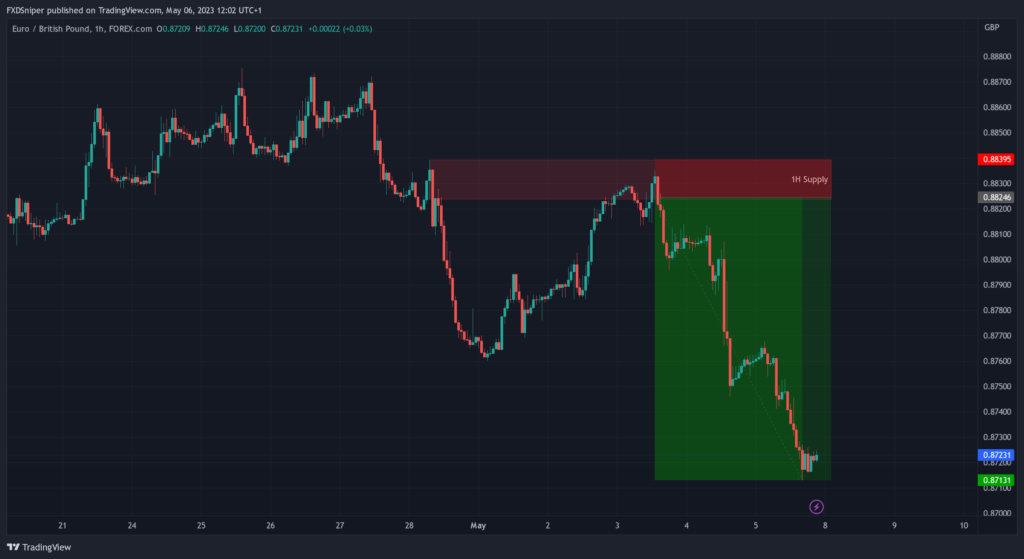
This is a 1:7,48 RR short trade on EUR/GBP taken from the latest supply zone on the 1h chart (last candle before reversal). Let’s go down to the 15min timeframe and refine our entry.
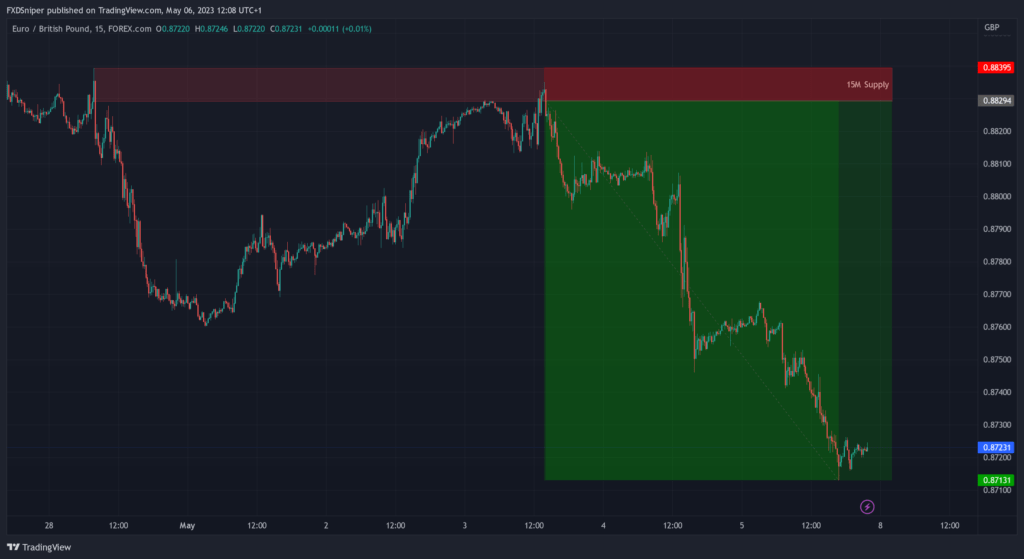
Same concept, last candle before reversal just on the smaller timeframe. Now we increased the risk to reward to 1:11,51.
But we can go even further than this. If you find the zone to big you can mark 50% of your zone and take the trade from there. Doing this might increase your chances of missing the trade, but in most cases price tends to go deeper into the zone especially if the pullback is taking more time / consolidates near the zone.
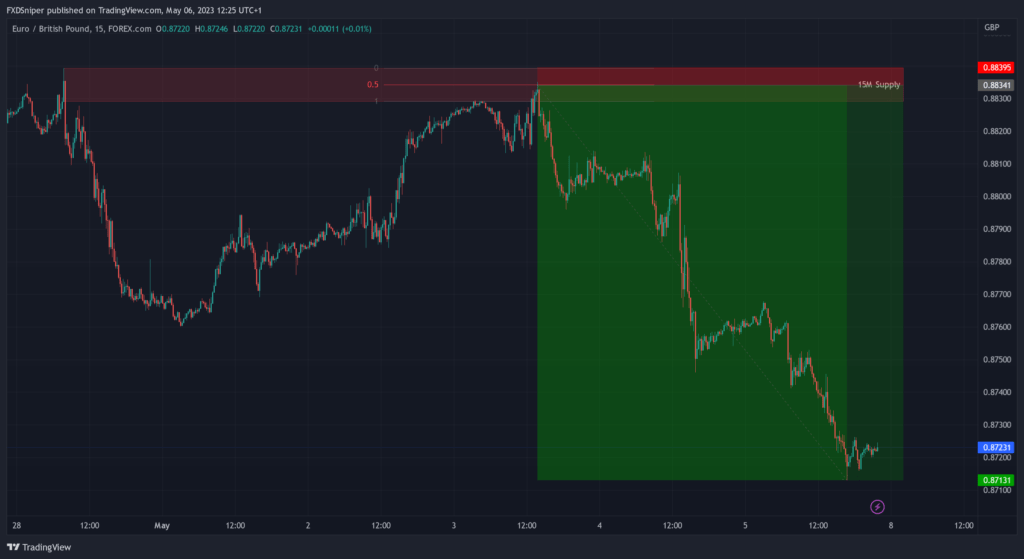
This is a beautiful 1:22,41 risk to reward trade. We increased the profit by almost 4x by simply refining our zone. Now that’s the real SMC way to trade.
Leading broker 16+ years in the industry
Spreads starting from 0.0 pips
Up to 1:2000 leverage
Trade Forex, Futures, Stocks and Commodities
Instant withdrawals get paid in under a minute
To Summarise
- Start marking out your zones on the 4h timeframe.
- Refine your zones by going down in timeframe following the same concepts.
- If applicable use 50% of your zone for entry.
- Stop loss must be placed below/above your zone.
- Your first target is the latest high/low or the latest supply and demand zone.
- Most common way to validate your s&d zone is to look for breaks in the market structure or following the trend.