Market structure is the most basic form of price movements in any market. It is also the most important aspect of any technical analysis. Without understanding the market structure you cannot identify any trends properly. Yes you can use something like a moving averages or other indicators to identify a trend but every single indicator that exists lags behind the current price action so by the time your indicator tells you the trend has changed you could be already in a trade if you just follow the pure structure.
Before we proceed, here is the basic terminology you need to know:
- HH – Higher high
- HL – Higher low
- LH – Lower high
- LL – Lower low
- EH – Equal high
- EL – Equal low
Identifying the basic form of Market Structure
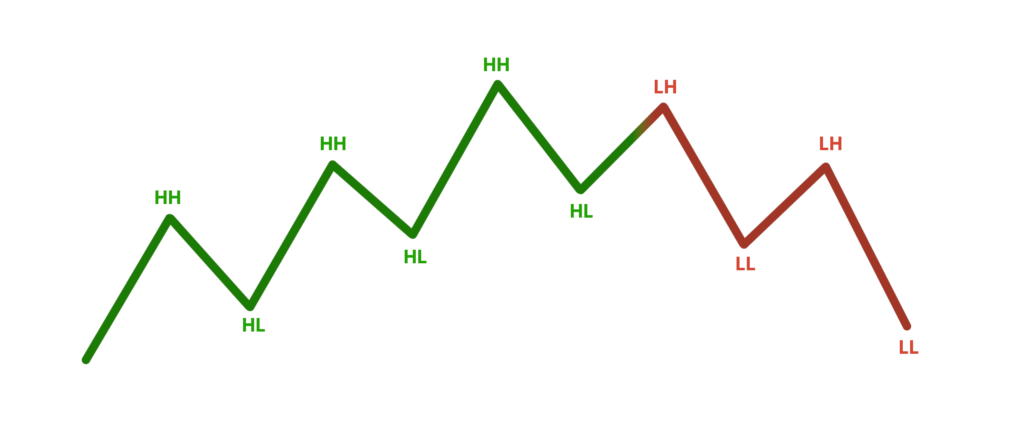
To determine whether the price is bullish the market structure must create a set of higher highs and higher lows.
To determine whether the price is bearish the market structure must create a set of lower highs and lower lows.
Obviously anyone can write two letters on a chart and pretend like they know what they’re doing. Doing something because someone told you so and actually understanding why you’re doing it is totally different.
Our members already secured 7-figures in funding capital. Join the FXD Academy and take your trading to the next level, click here to learn more.
Let me give you an example:
When the price is creating a bullish structure(HH) everyone participating in the bullish move will set their new orders below 50% of the current move that created the higher high, ideally between the 50% and the last higher low.
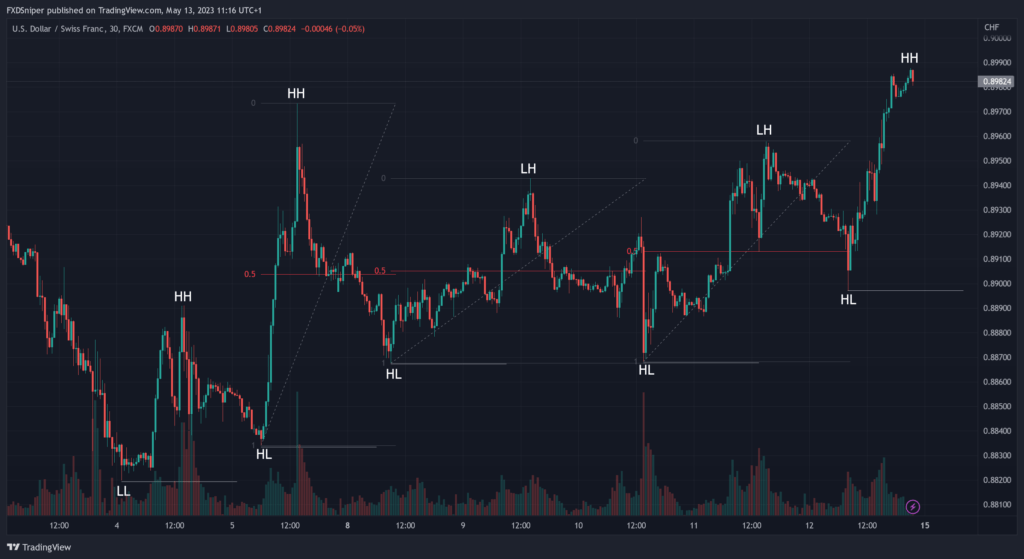
Looking at the image above you can see that everytime price was retracing down it went below the 50% of the last move and it did not break structure. That’s why breaking the structure would invalidate the trend and it would mean the price is no longer bullish.
By simply modifying your fibonacci retracement tool to show you only the 50% of the move you can significantly increase your win rate by only looking for trades when price is in your 50% range. Of course markets are rarely this pretty and we have spikes and manipulation in both directions. To avoid getting yourself trapped in a losing trade simply follow the higher timeframe structure and only use lower timeframe structure once your higher timeframe aligns with the trend. I’ll get into more details later on.
How to identify the change in Market Structure?
Over the last couple of years the term ChoCH (Change of Character) or Flip has become very popular in the forex world. Although it is widely misused and misunderstood that’s why I’m not a fan of them, I still use the term ChoCh on a lot of my analysis shown publicly just because everyone is familiar with it and I don’t have to explain my analysis everytime I post something.
To identify a change in trend from bearish to bullish you want to see LHs and LLs change into HLs and HHs and vice versa for a change from bullish to bearish.
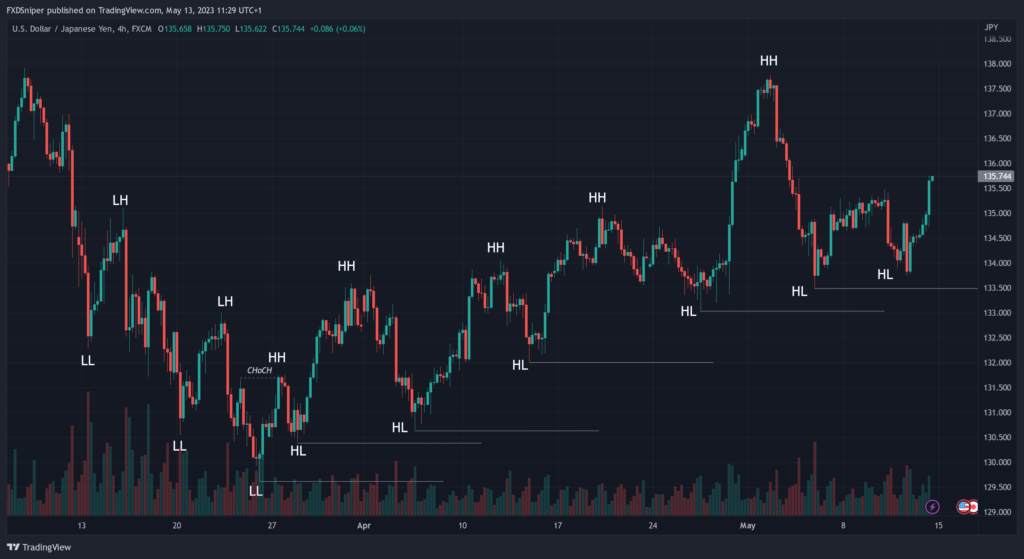
It doesn’t get any cleaner than this. This is USD/JPY on 4h over the last 2 months. UJ was in a downtrend until the last lower low was created and the price pushed up breaking the previous structure confirming the change in trend. Since then the price has not broken a single higher timeframe structure and is continuing its trend.
Become a VIP and get access to exclusive insights, powerful trading indicators and other resources, click here to join now.
How many of you lost a buy trade on UJ since the change of trend? If you simple followed the higher timeframe structure and used the 50% rule most of your losses could have been avoided.
This applies to all timeframes. Let me show you a trade example on the 1min timeframe.
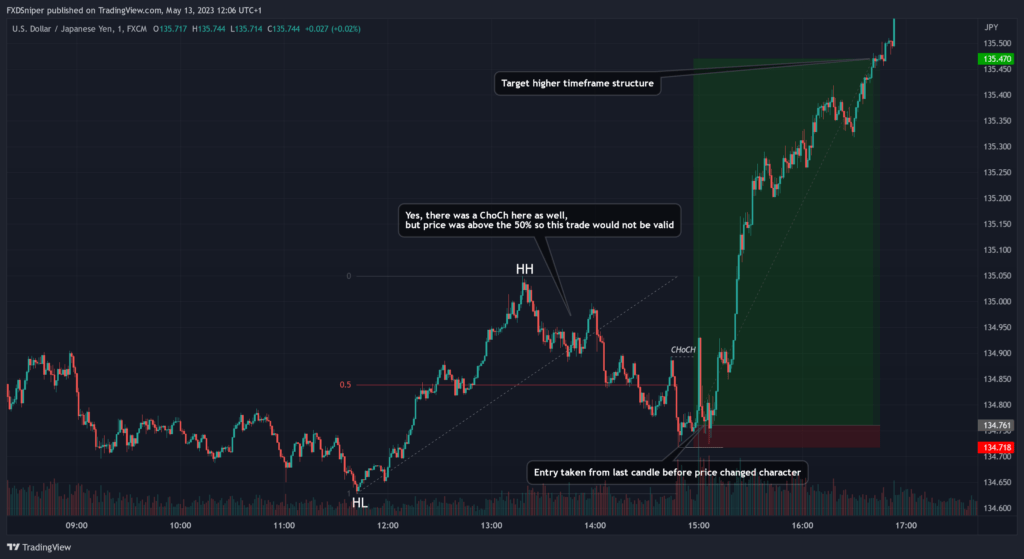
This was a 1:16.5 RR trade. This trade was only valid because the higher timeframe structure is bullish. The most important part of trading the 1m timeframe is knowing your bias, if your bias was short you would never even consider this as a trade and you would be looking for short trades that would most likely hit your stop loss.
Market Structure in a ranging market
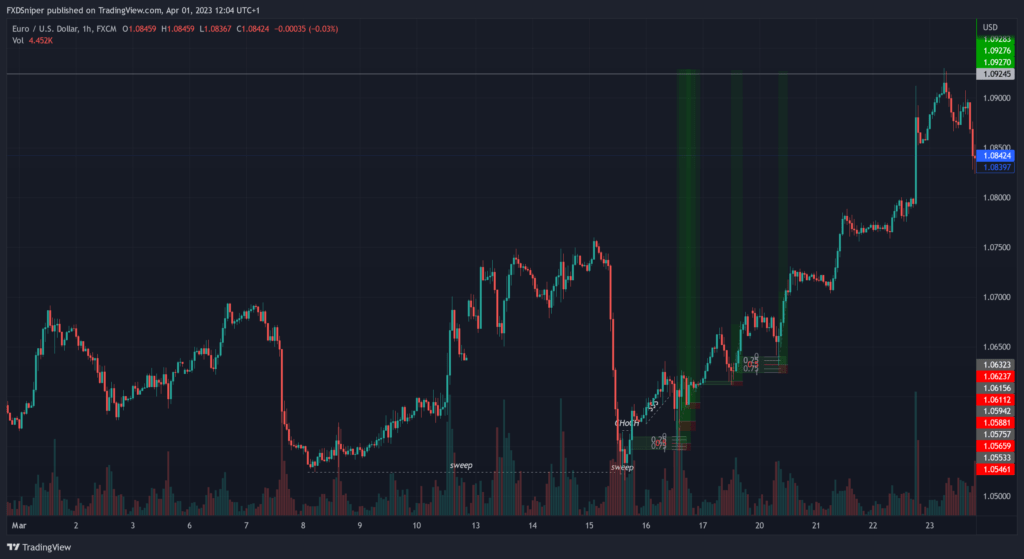
Nothing is ever easy when it comes to trading forex, charts rarely look as clean as my previous examples. Most of the time your chart will look something like this:
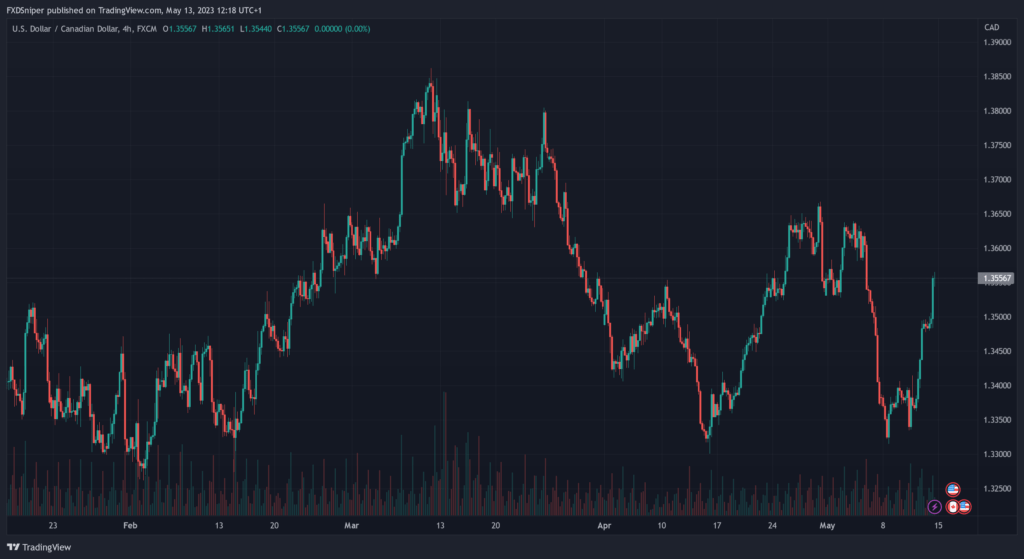
How do you even start here? The price went up, broke structure and came down, then it went up changing structure again just to come down again just to go up again…
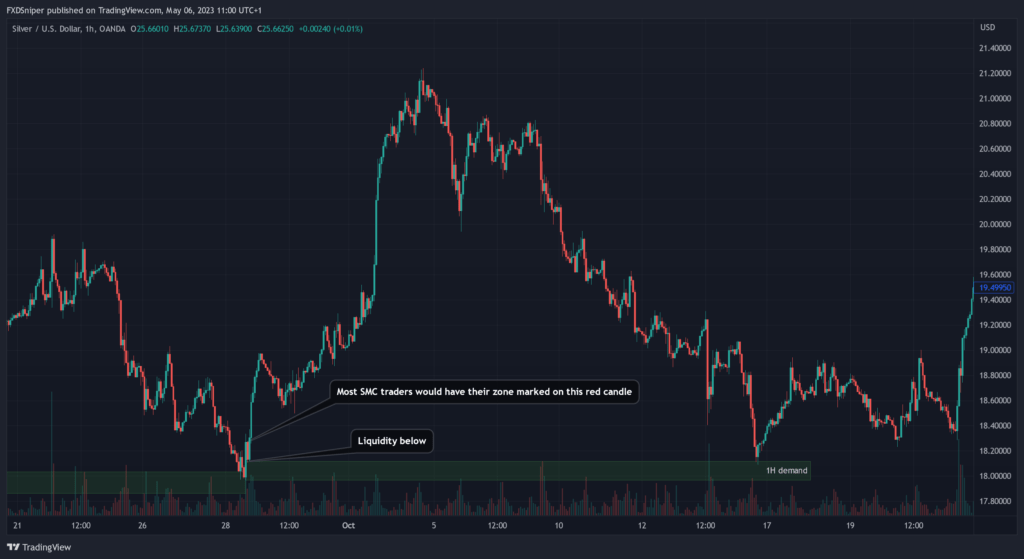
Well, that’s why you can’t use market structure alone. You need another strategy for extra confluence. So I’m gonna show you an analysis based on market structure and supply & demand.
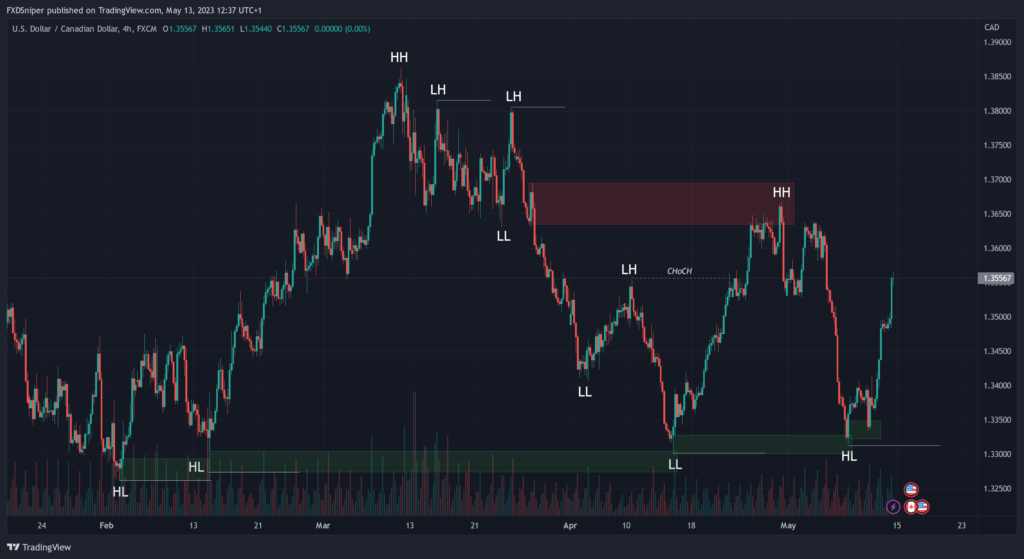
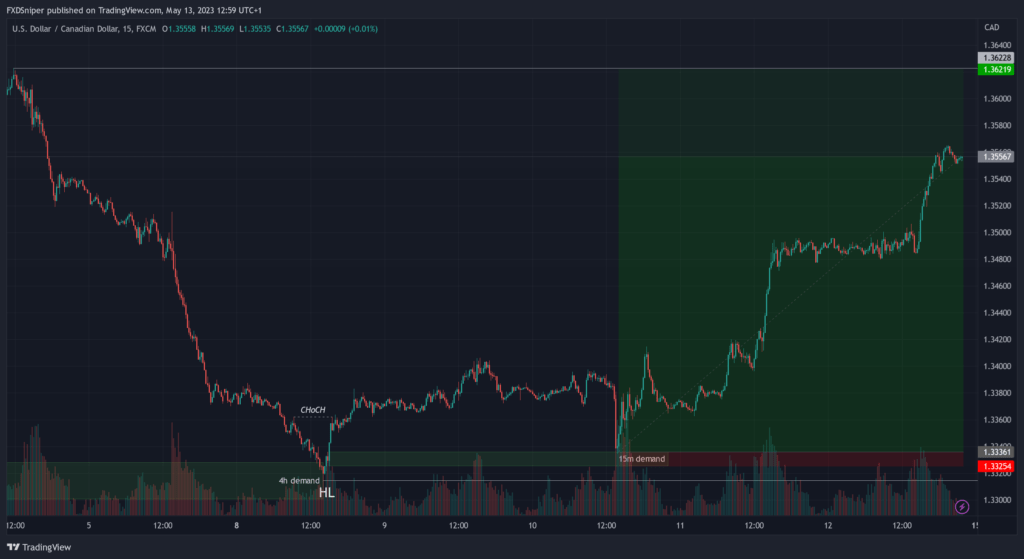
I know this may look a bit confusing to some so let me break it down from the beginning.
- Overall, the higher timeframe trend is bullish. It will only turn bearish if the first HL gets taken out (which it didn’t)
- After price made a new HH it failed to go any further and it started to break structure to the downside. At this point we know the short term trend is turning bearish. So it’s okay for you to look for shorts.
- Price creates a new LL tapping into the lowest demand zone and reverses also changing character. At this point the price has aligned with the higher timeframe trend again so we know we will most likely continue to go up.
- However there is an unmitigated supply zone(which gets tapped, HH), this means price is most likely to react in that zone and push the price down. This move up also created a bunch of unmitigated demand zones which must be filled at some point. That’s where you start looking for buys.
I know it might still be a lot to take for some of you so make sure you go through this as many times as necessary and understand what is happening here.
Taking all of this into consideration, the last HL on the chart gave you a reaction. That reaction is confirmation to start looking for buys. If you’ve been following what I said before you would start looking for a change of character on a lower timeframe and take a trade from a valid demand zone.
Again this is a 1:26.7 RR trade. 99% of mentors out there tell you a 1:1 and 1:2 is the most risk to reward you should ever aim for as it’s impossible to achieve anything higher than that consistently. That’s because these people don’t understand how and why price moves, they simply trade based on probabilities like flipping a coin. Once you actually start to understand price and the concepts that run the markets the possibilities are endless.
Leading broker 16+ years in the industry
Spreads starting from 0.0 pips
Up to 1:2000 leverage
Trade Forex, Futures, Stocks and Commodities
Instant withdrawals get paid in under a minute
To Summarise
- Always follow the higher timeframe(4h/Daily/Weekly) structure.
- When taking trades on lower timeframe(1m-15m) your lower timeframe structure must align with higher timeframe.
- Price usually retraces more than 50% after each move, any trade taken before 50% retracement happened is not valid.
- Use supply and demand or any other strategy of your choice for extra confluence.