The FXD Volume Signal is a high-precision market reversal and trend exhaustion indicator built for intraday traders who rely on volume-based conviction and trend alignment. It’s designed to catch key turning points in the market by detecting unusual volume spikes that happen against the prevailing trend, signaling potential exhaustion or institutional involvement.
What It Does
- Detects volume spike clusters that could indicate reversals or strong reactions.
- Confirms these spikes with a trend filter, range/ATR filter, and price action context.
- Identifies buy and sell signals at logical exhaustion points — when the market is overextended and smart money might be stepping in.
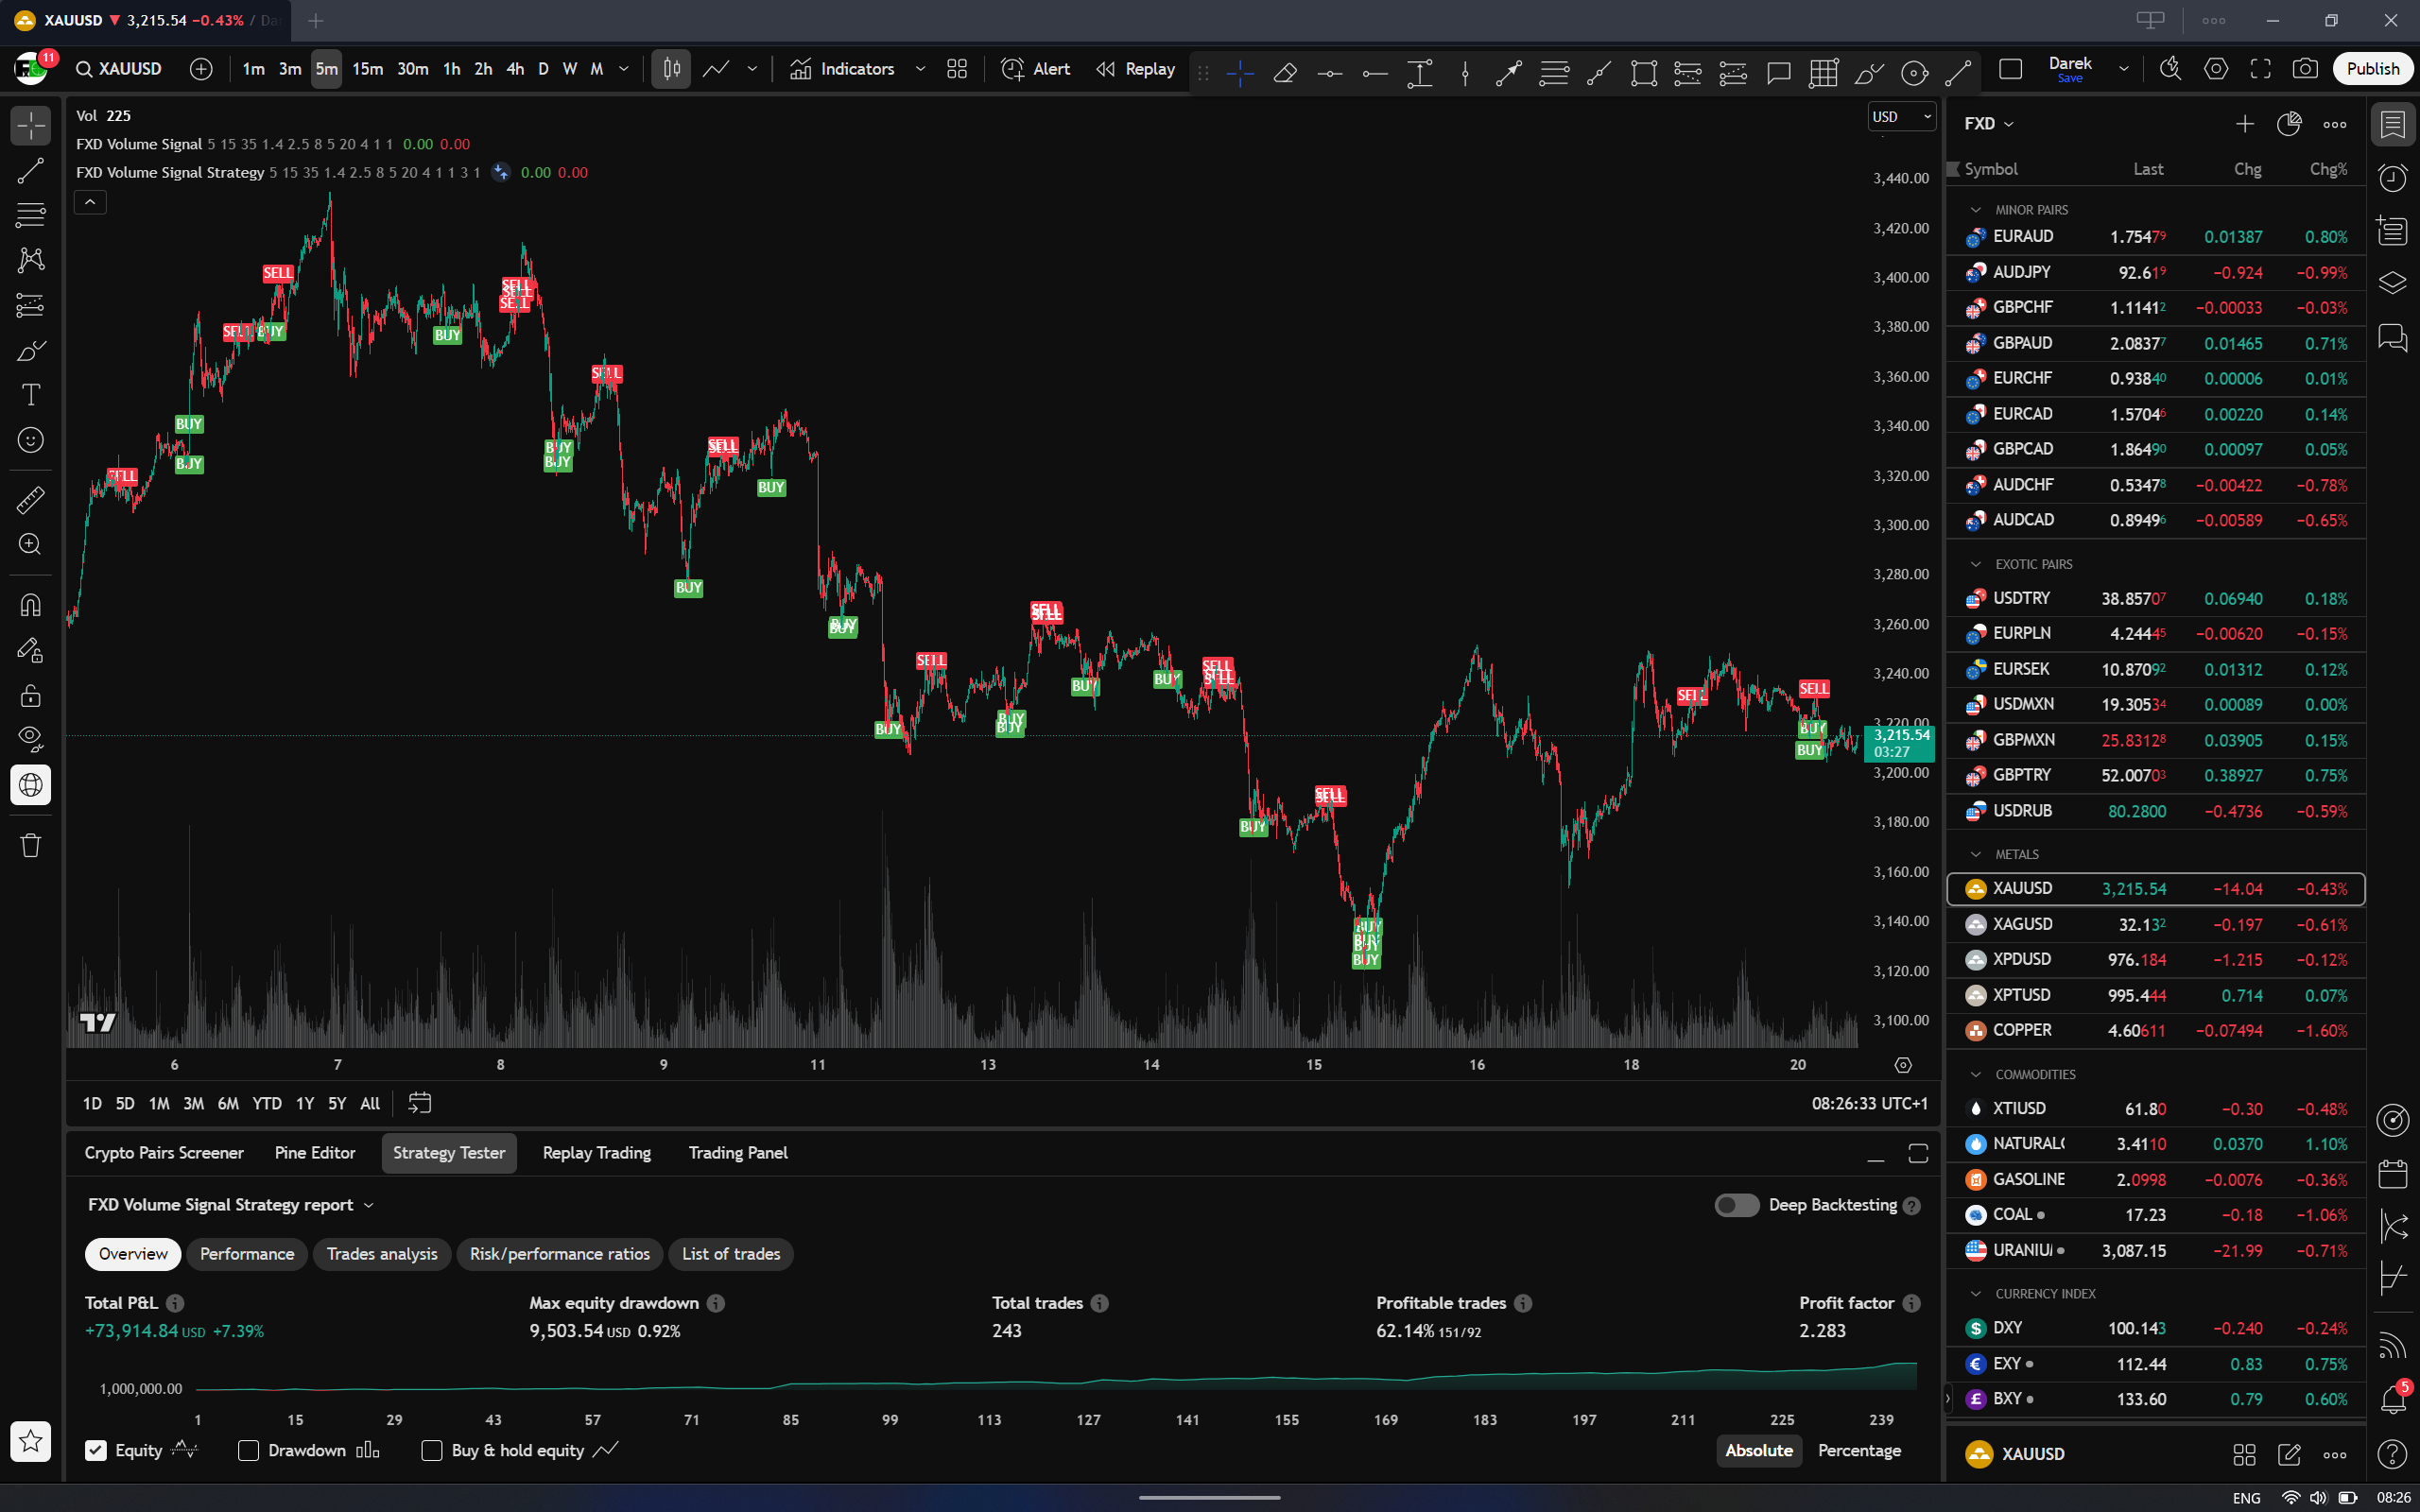
The indicator was built to perform the best on a 5 minute timeframe trading XAUUSD but it performs just as well or even better across all major and minor forex pairs (with a few settings adjustments) and on different timeframes too.
There are over 1000 setting combinations to play around with which make this indicator adaptable to any trading style and any market. All of those are explained in our tutorial videos.
How It Works (Behind the Scenes)
- Volume Spike Detection
- The script tracks clusters of bars where volume exceeds a moving average baseline by a user-defined multiplier.
- It looks at the last N bars to count how many of those had high volume — ensuring this isn’t just a one-off event.
- Trend Filter
- A higher timeframe moving average defines whether the market is trending up or down.
- Signals only appear against the trend, implying a potential reversal or correction is setting up.
- Range-to-ATR Filter
- Ensures the market is expanding, not ranging.
- Uses a range vs. ATR ratio to detect when price action is strong enough to be meaningful.
- Engulfing Candle Filter
- Blocks or delays signals when X consecutive engulfing candles suggest overwhelming momentum in the wrong direction.
- Can be overridden if volume is exceptionally high (via the high-volume multiplier).
- Structure Break Confirmation
- Optional logic checks if there’s been a break of minor structure (based on 1-minute pivots).
- Helps filter out weak signals and adds confidence before taking a trade.
Buy Signal Example
- Trend is down (e.g., price below 15m moving average)
- A cluster of high volume bars prints
- Market is trending by range/ATR ratio
- No major bearish engulfing momentum
- Structure has been broken upward (optional)
→ The indicator plots a BUY label below the candle.
Sell Signal Example
- Trend is up (price above 15m MA)
- Volume cluster detected
- Market is trending
- No strong bullish momentum continuing
- Structure break down (optional)
→ The indicator plots a SELL label above the candle.
Who This Is For
- Intraday traders and scalpers looking for precision entries
- Traders who want to avoid overtrading and only trade clean, high-volume setups
- Anyone who understands that volume precedes price and wants to see that principle visualized
Indicator Performance Across Multiple Assets
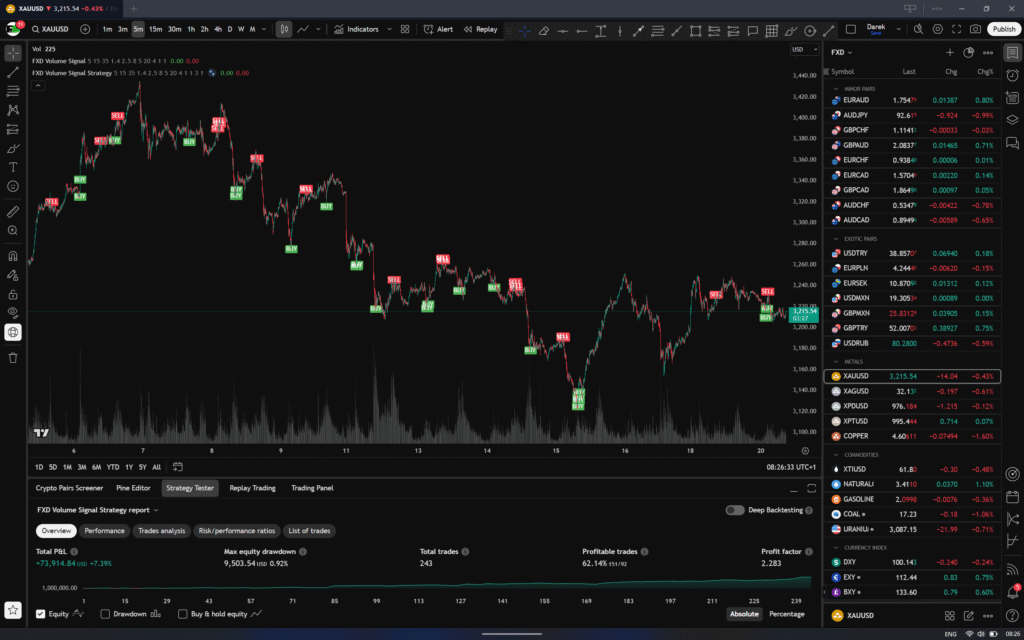
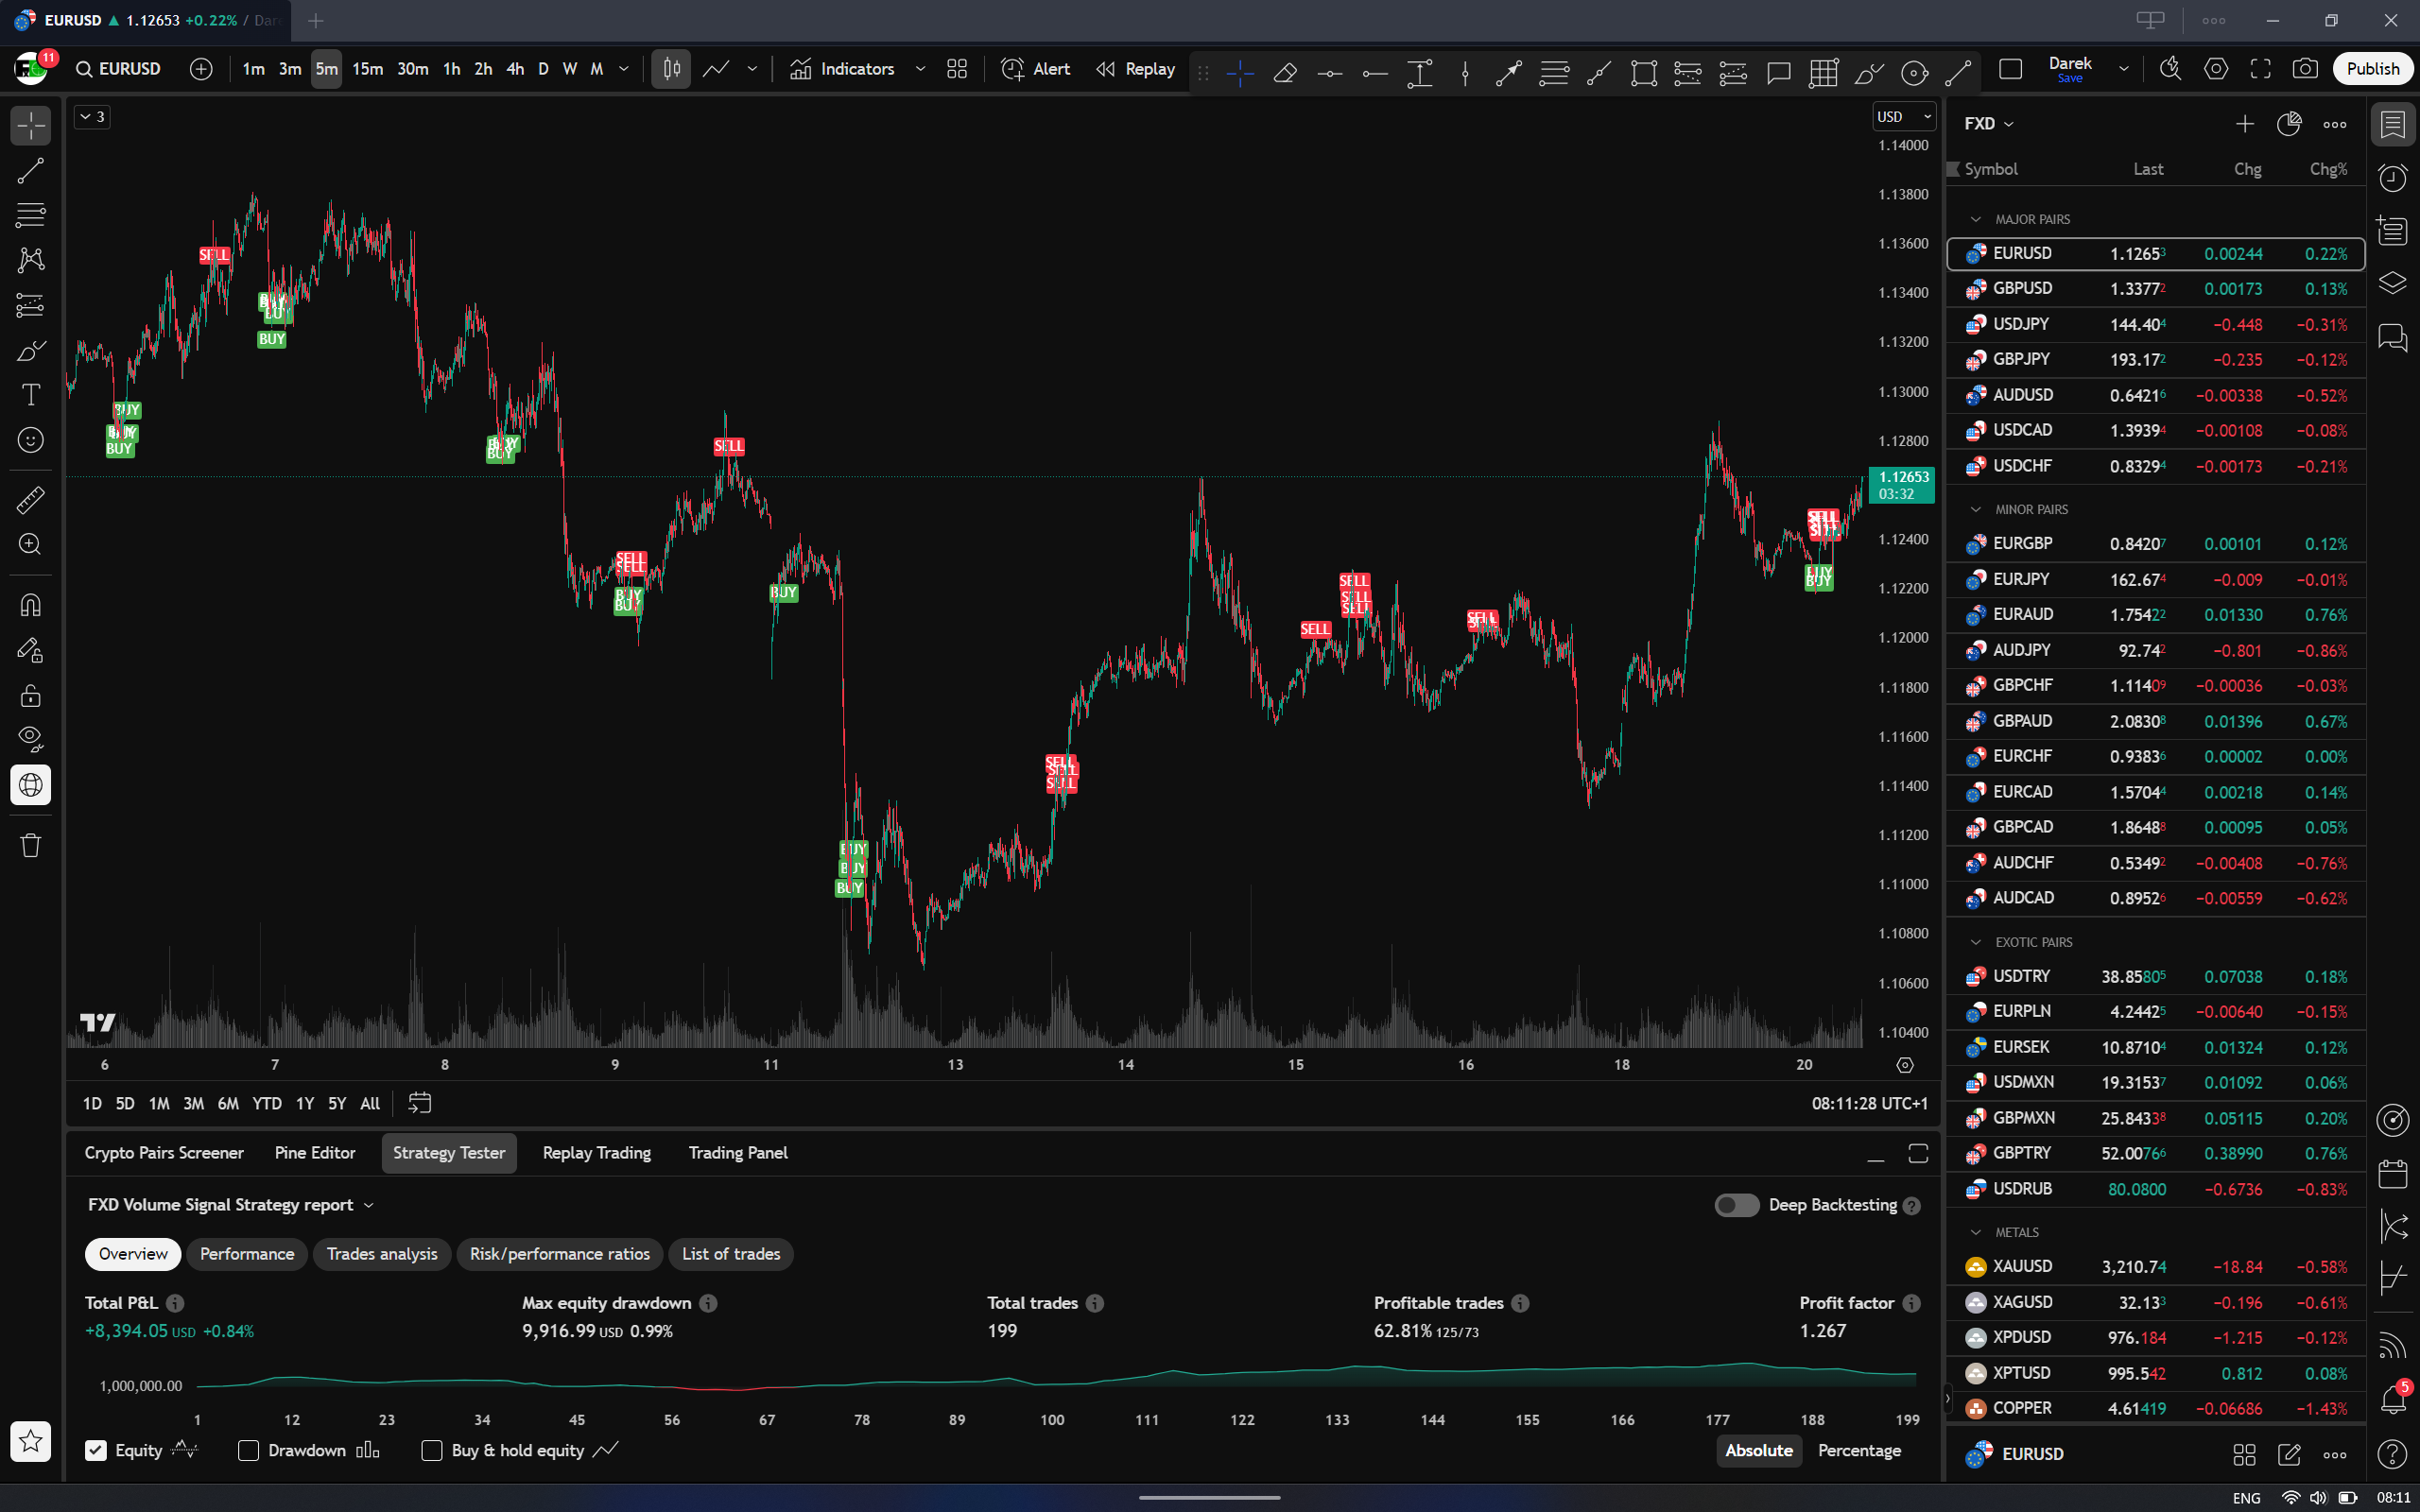
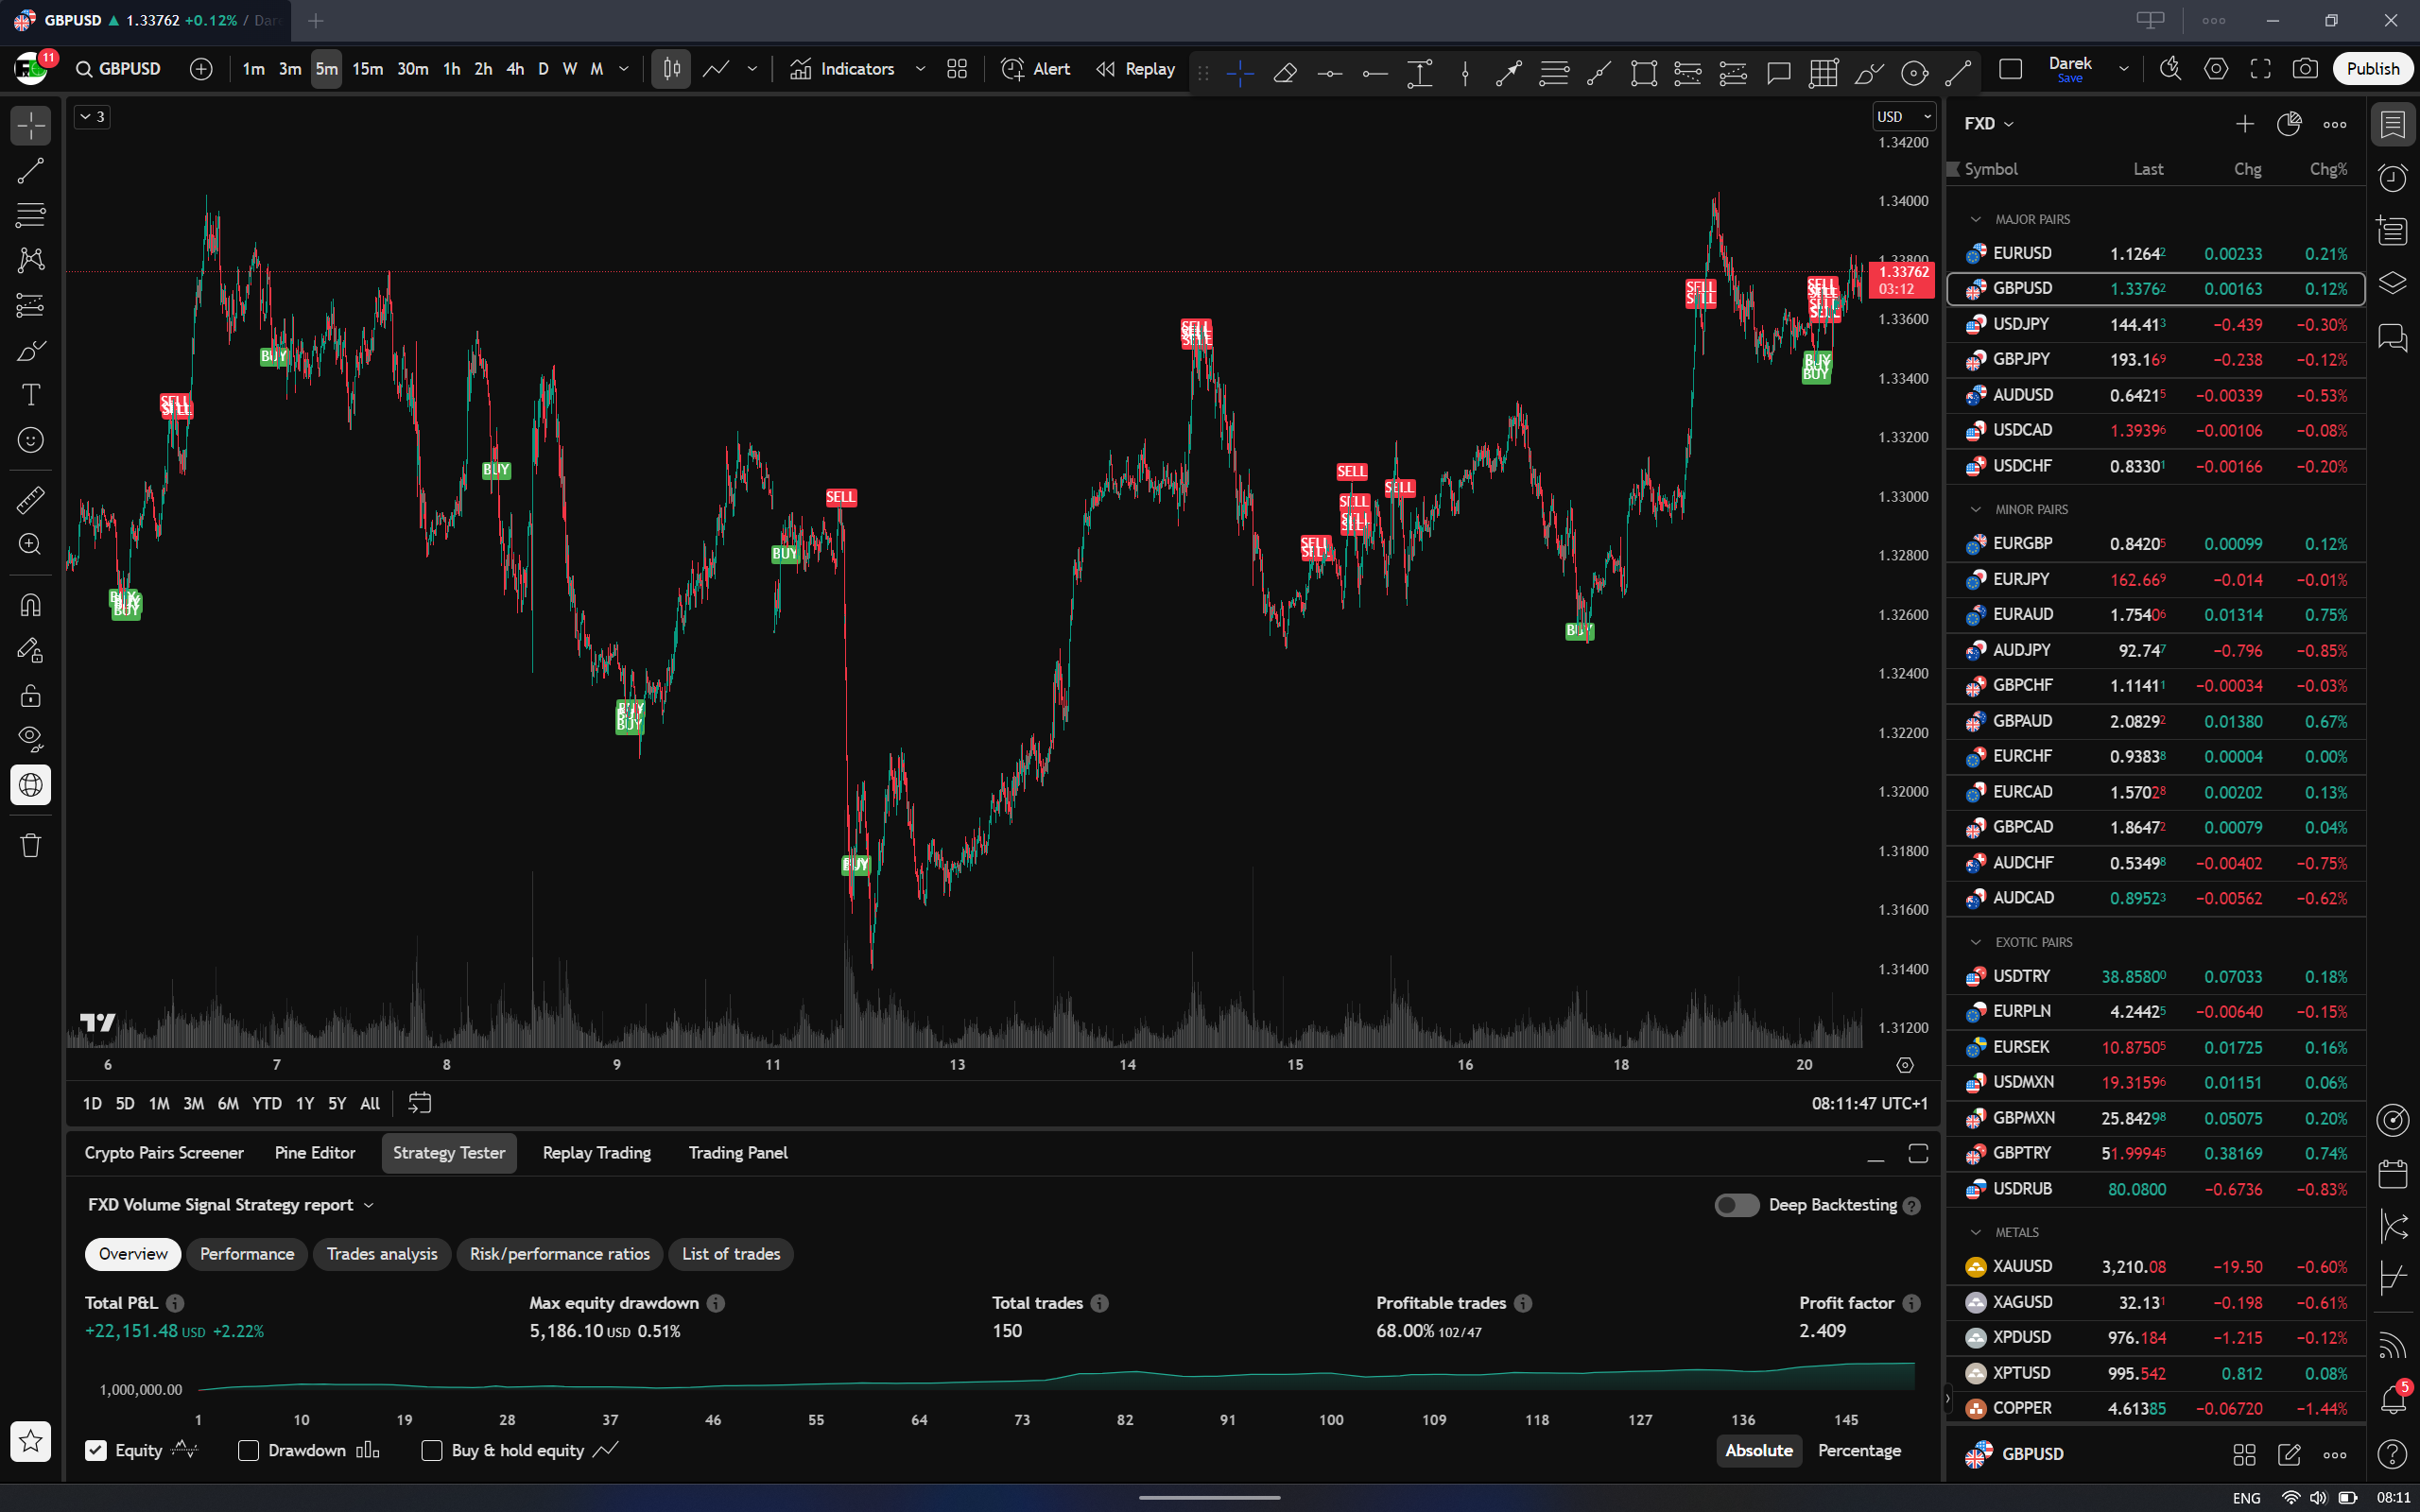
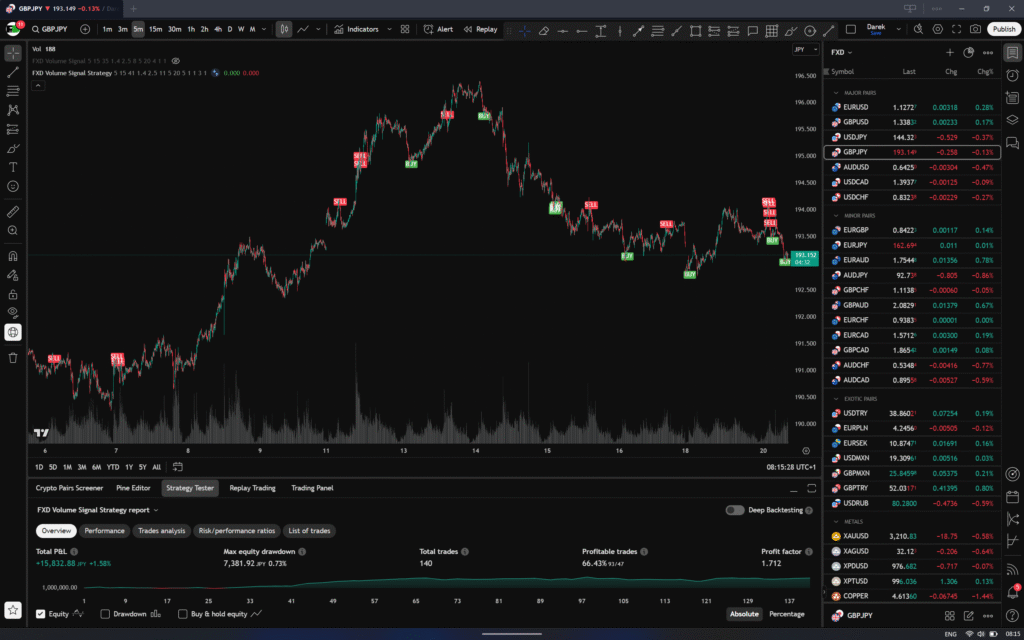
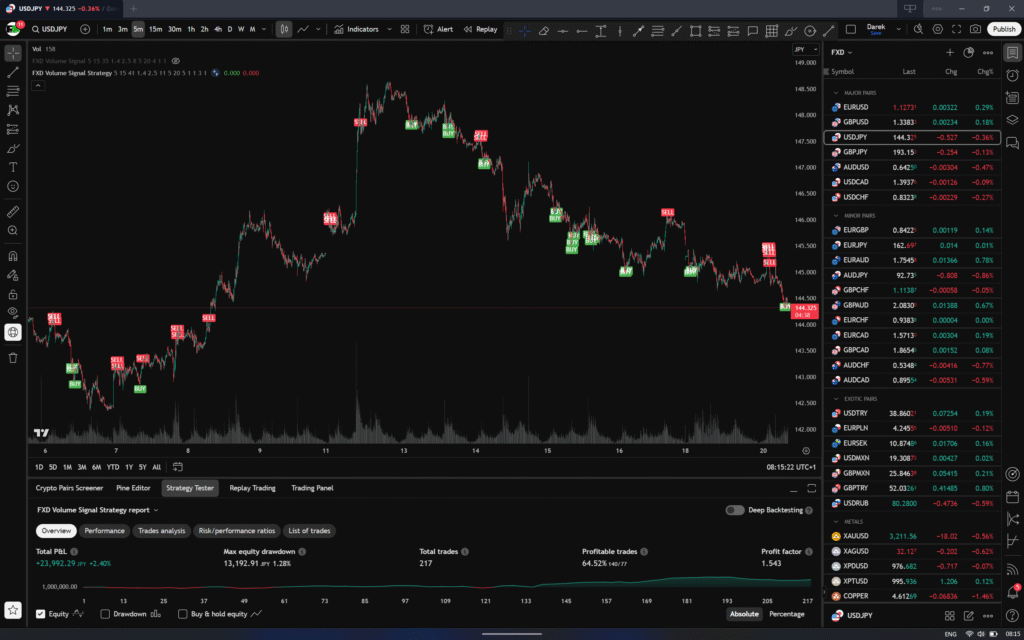
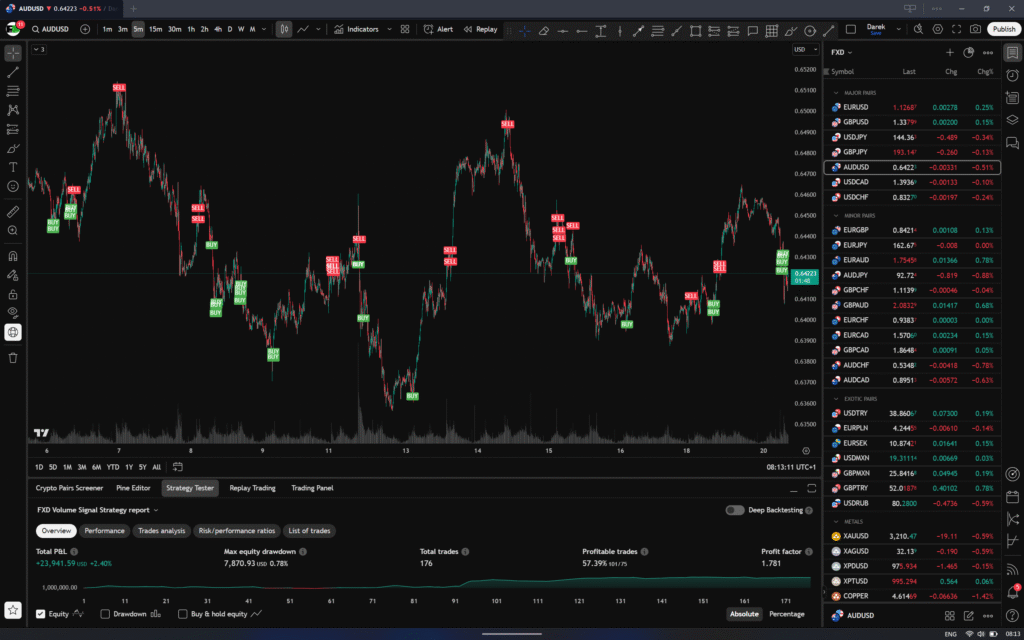
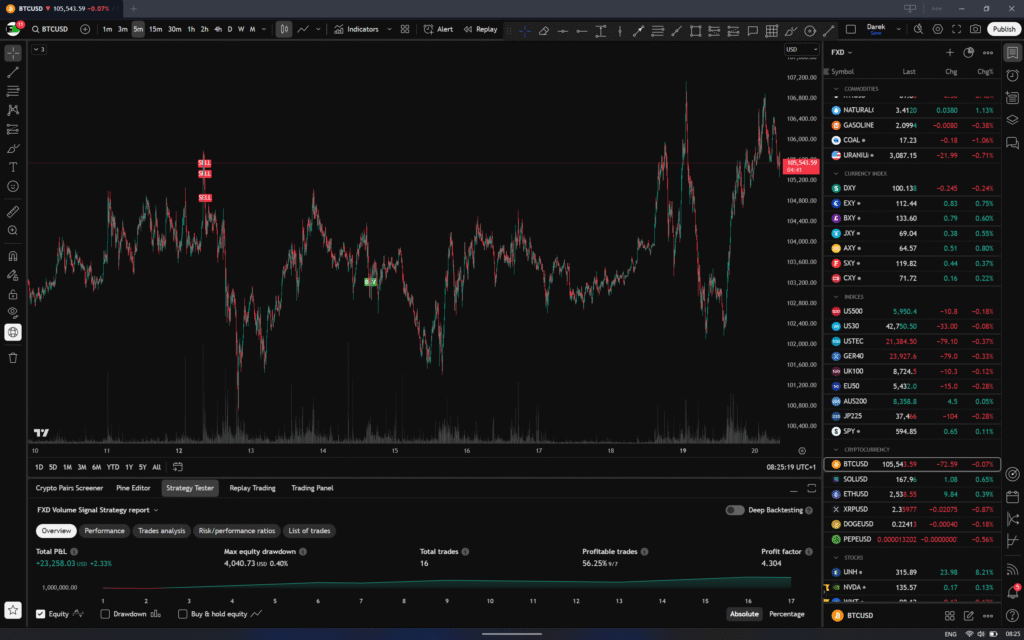
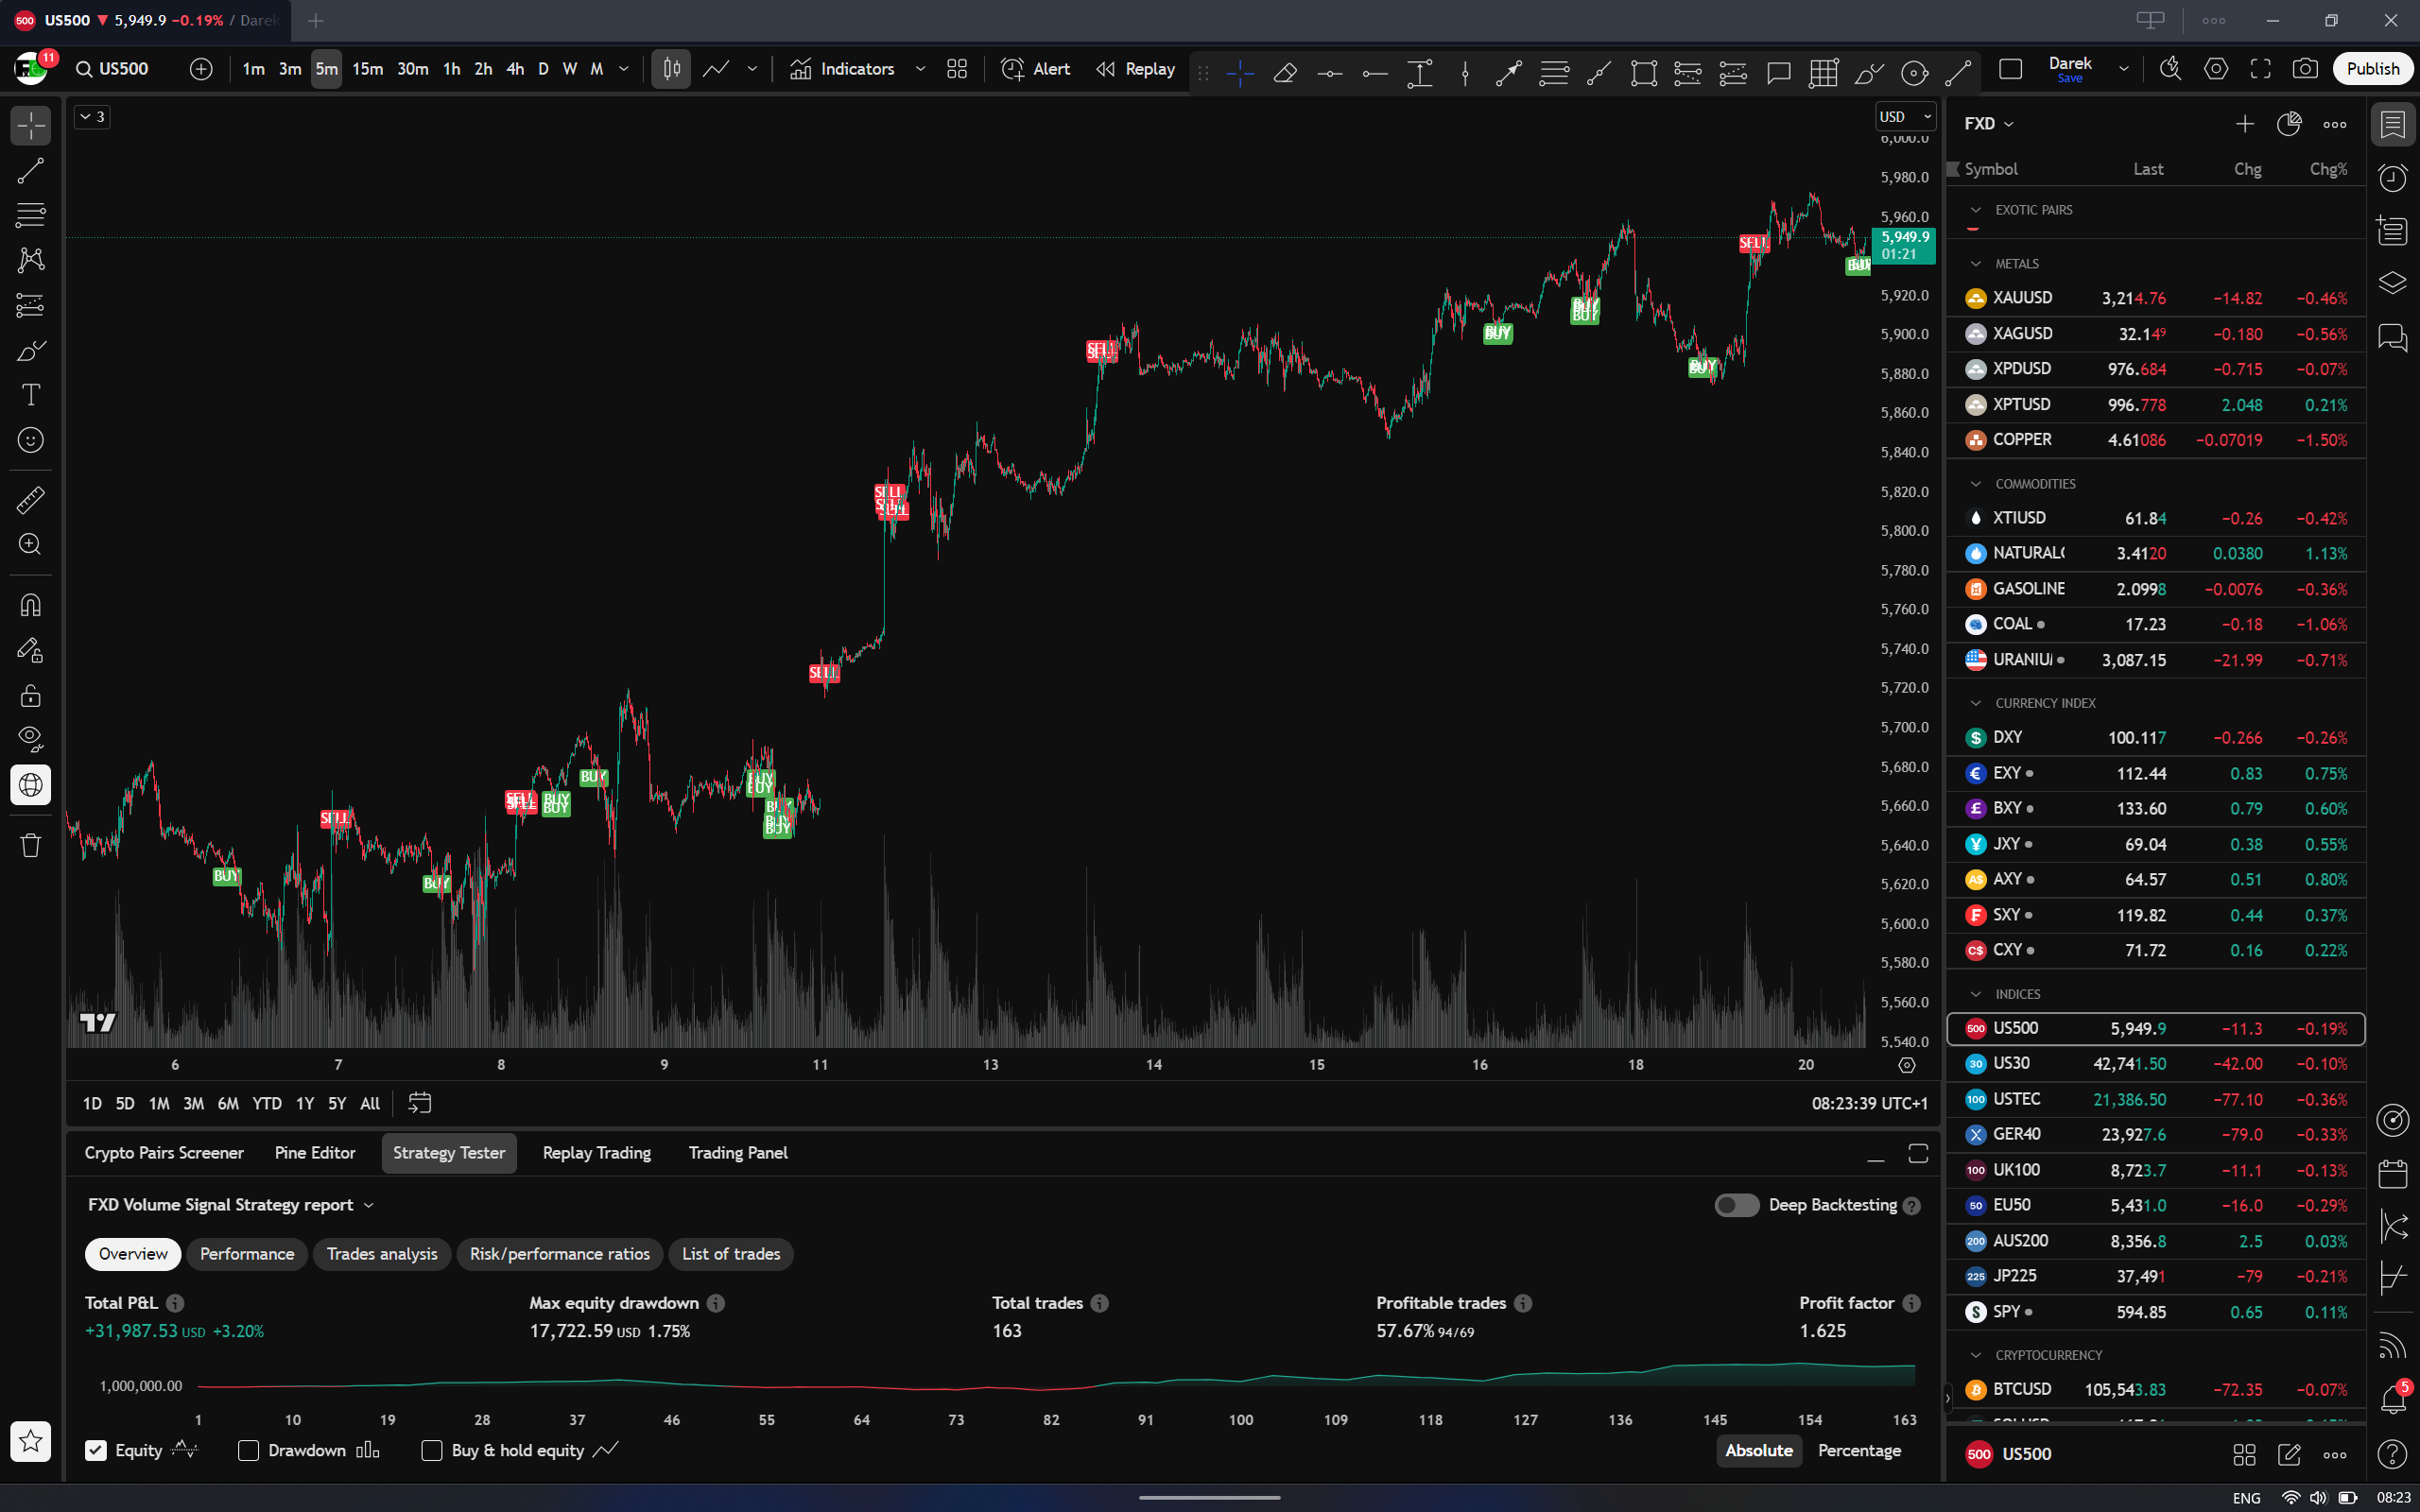
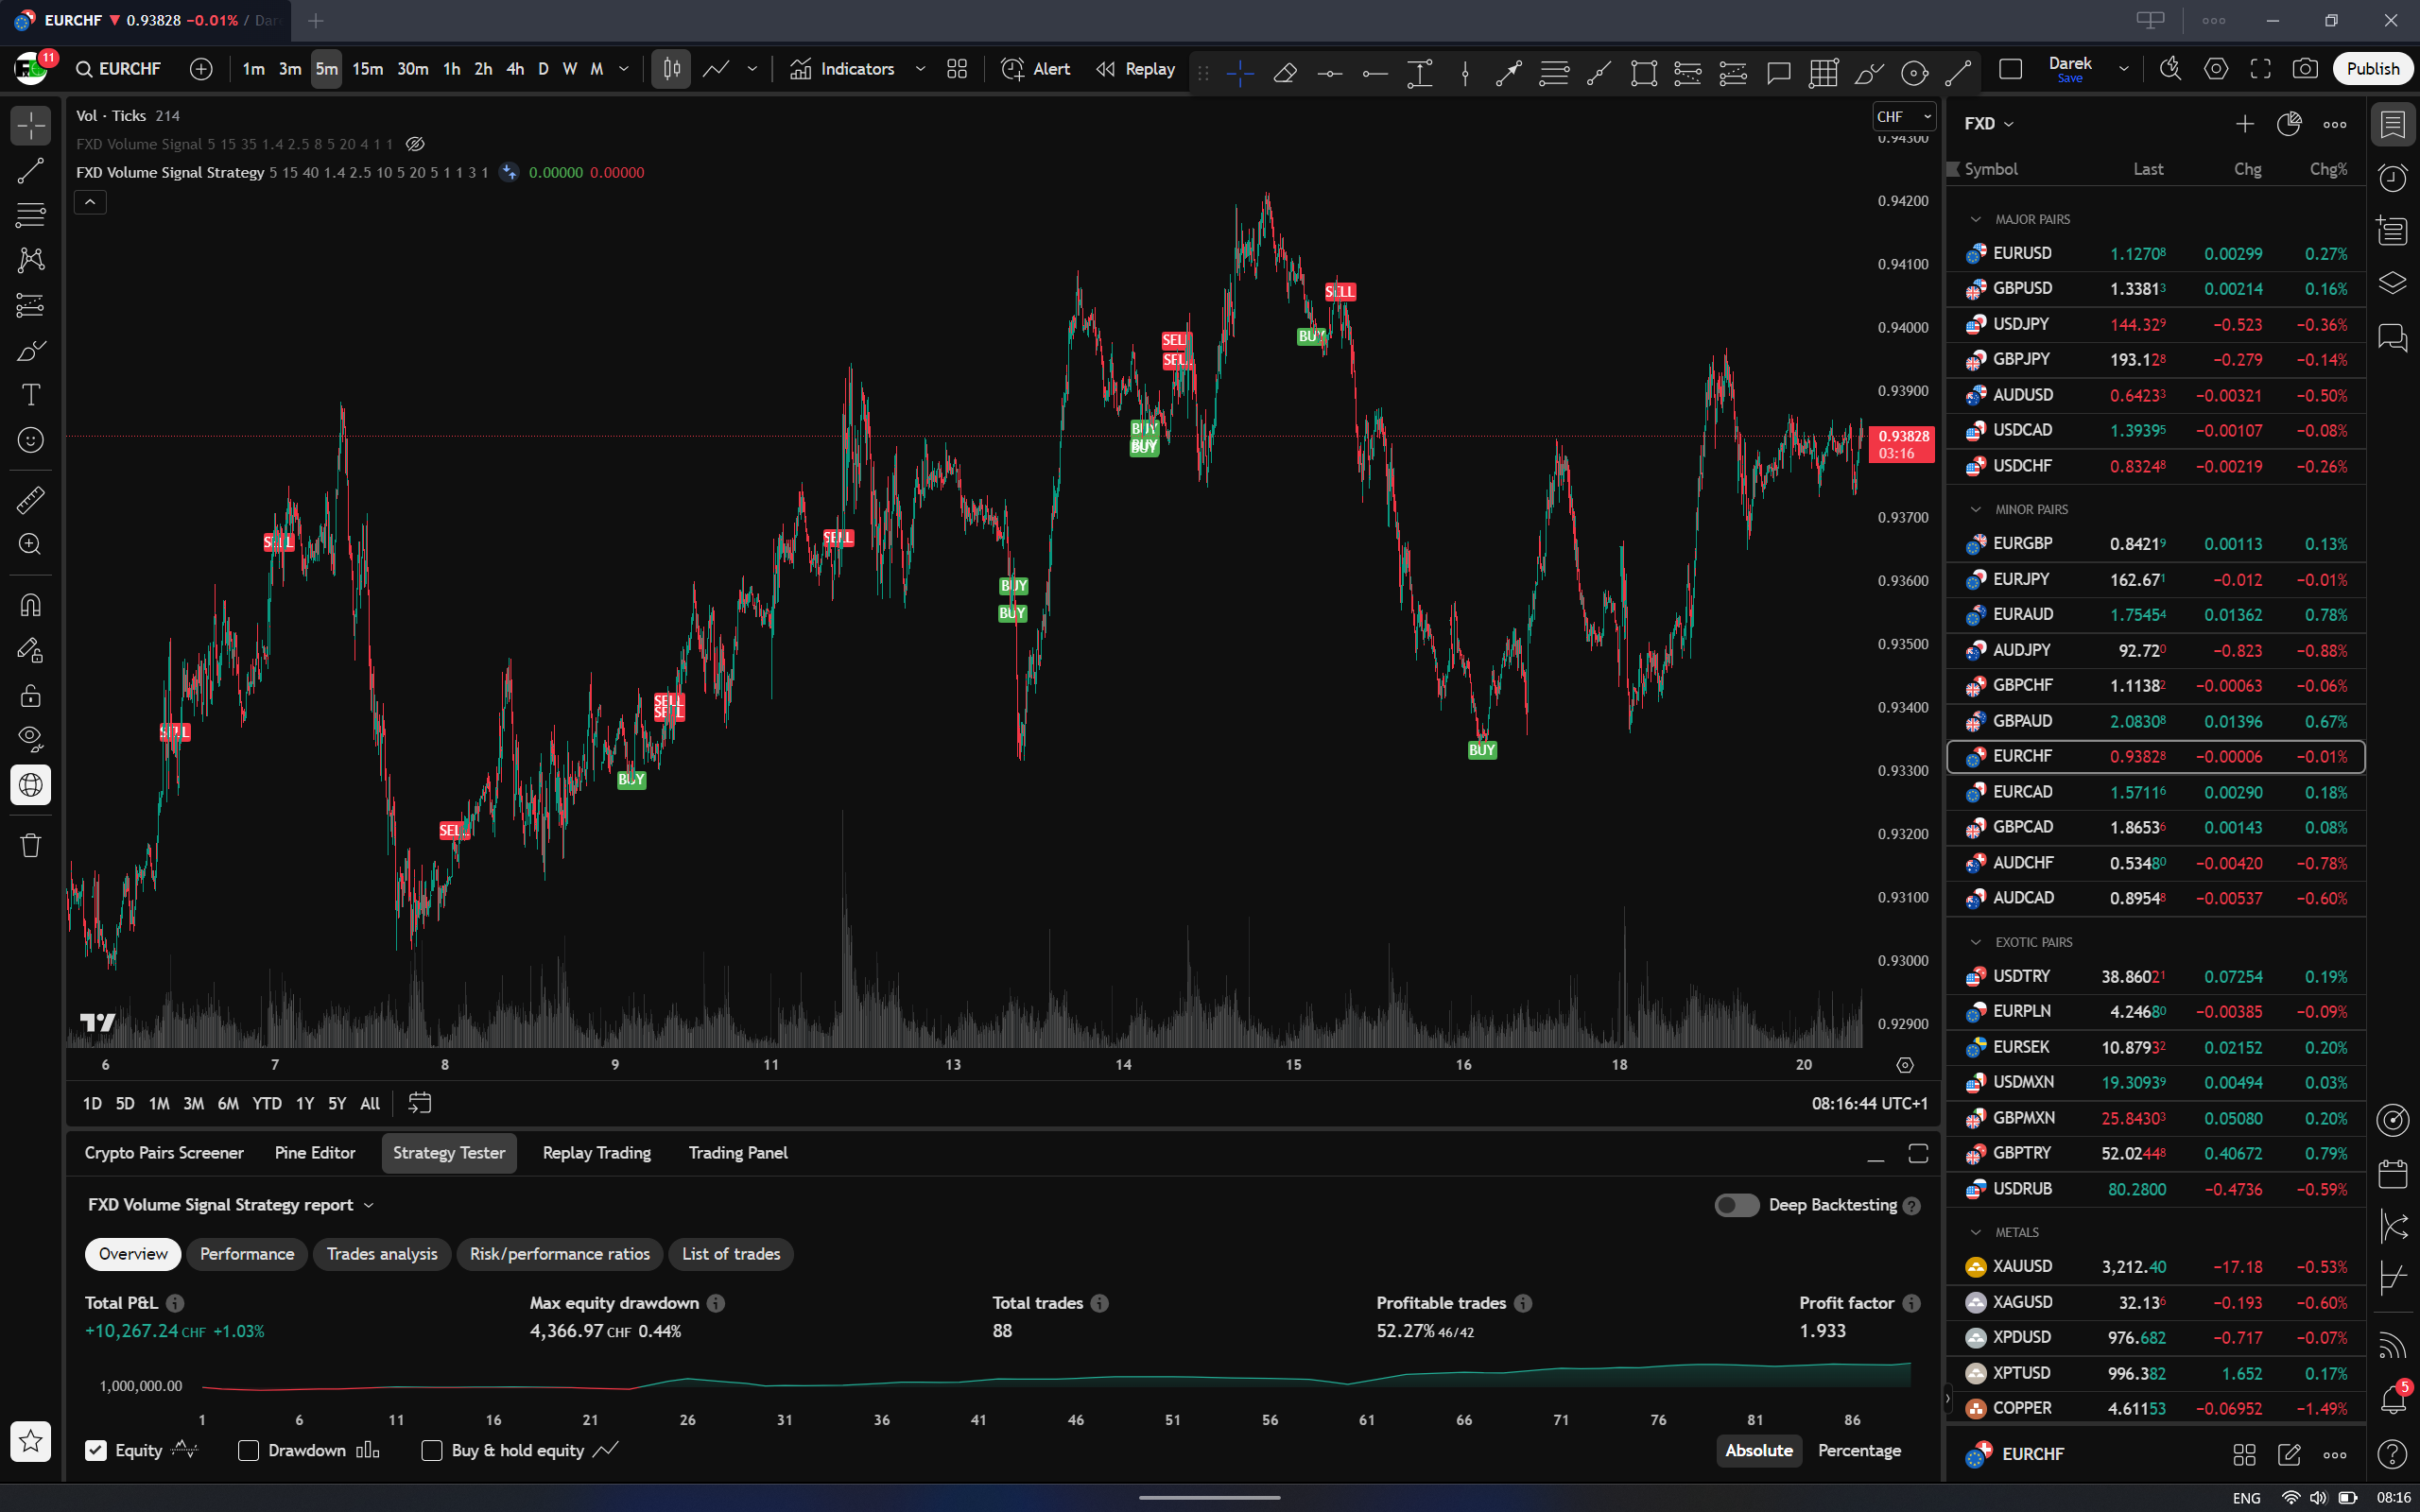
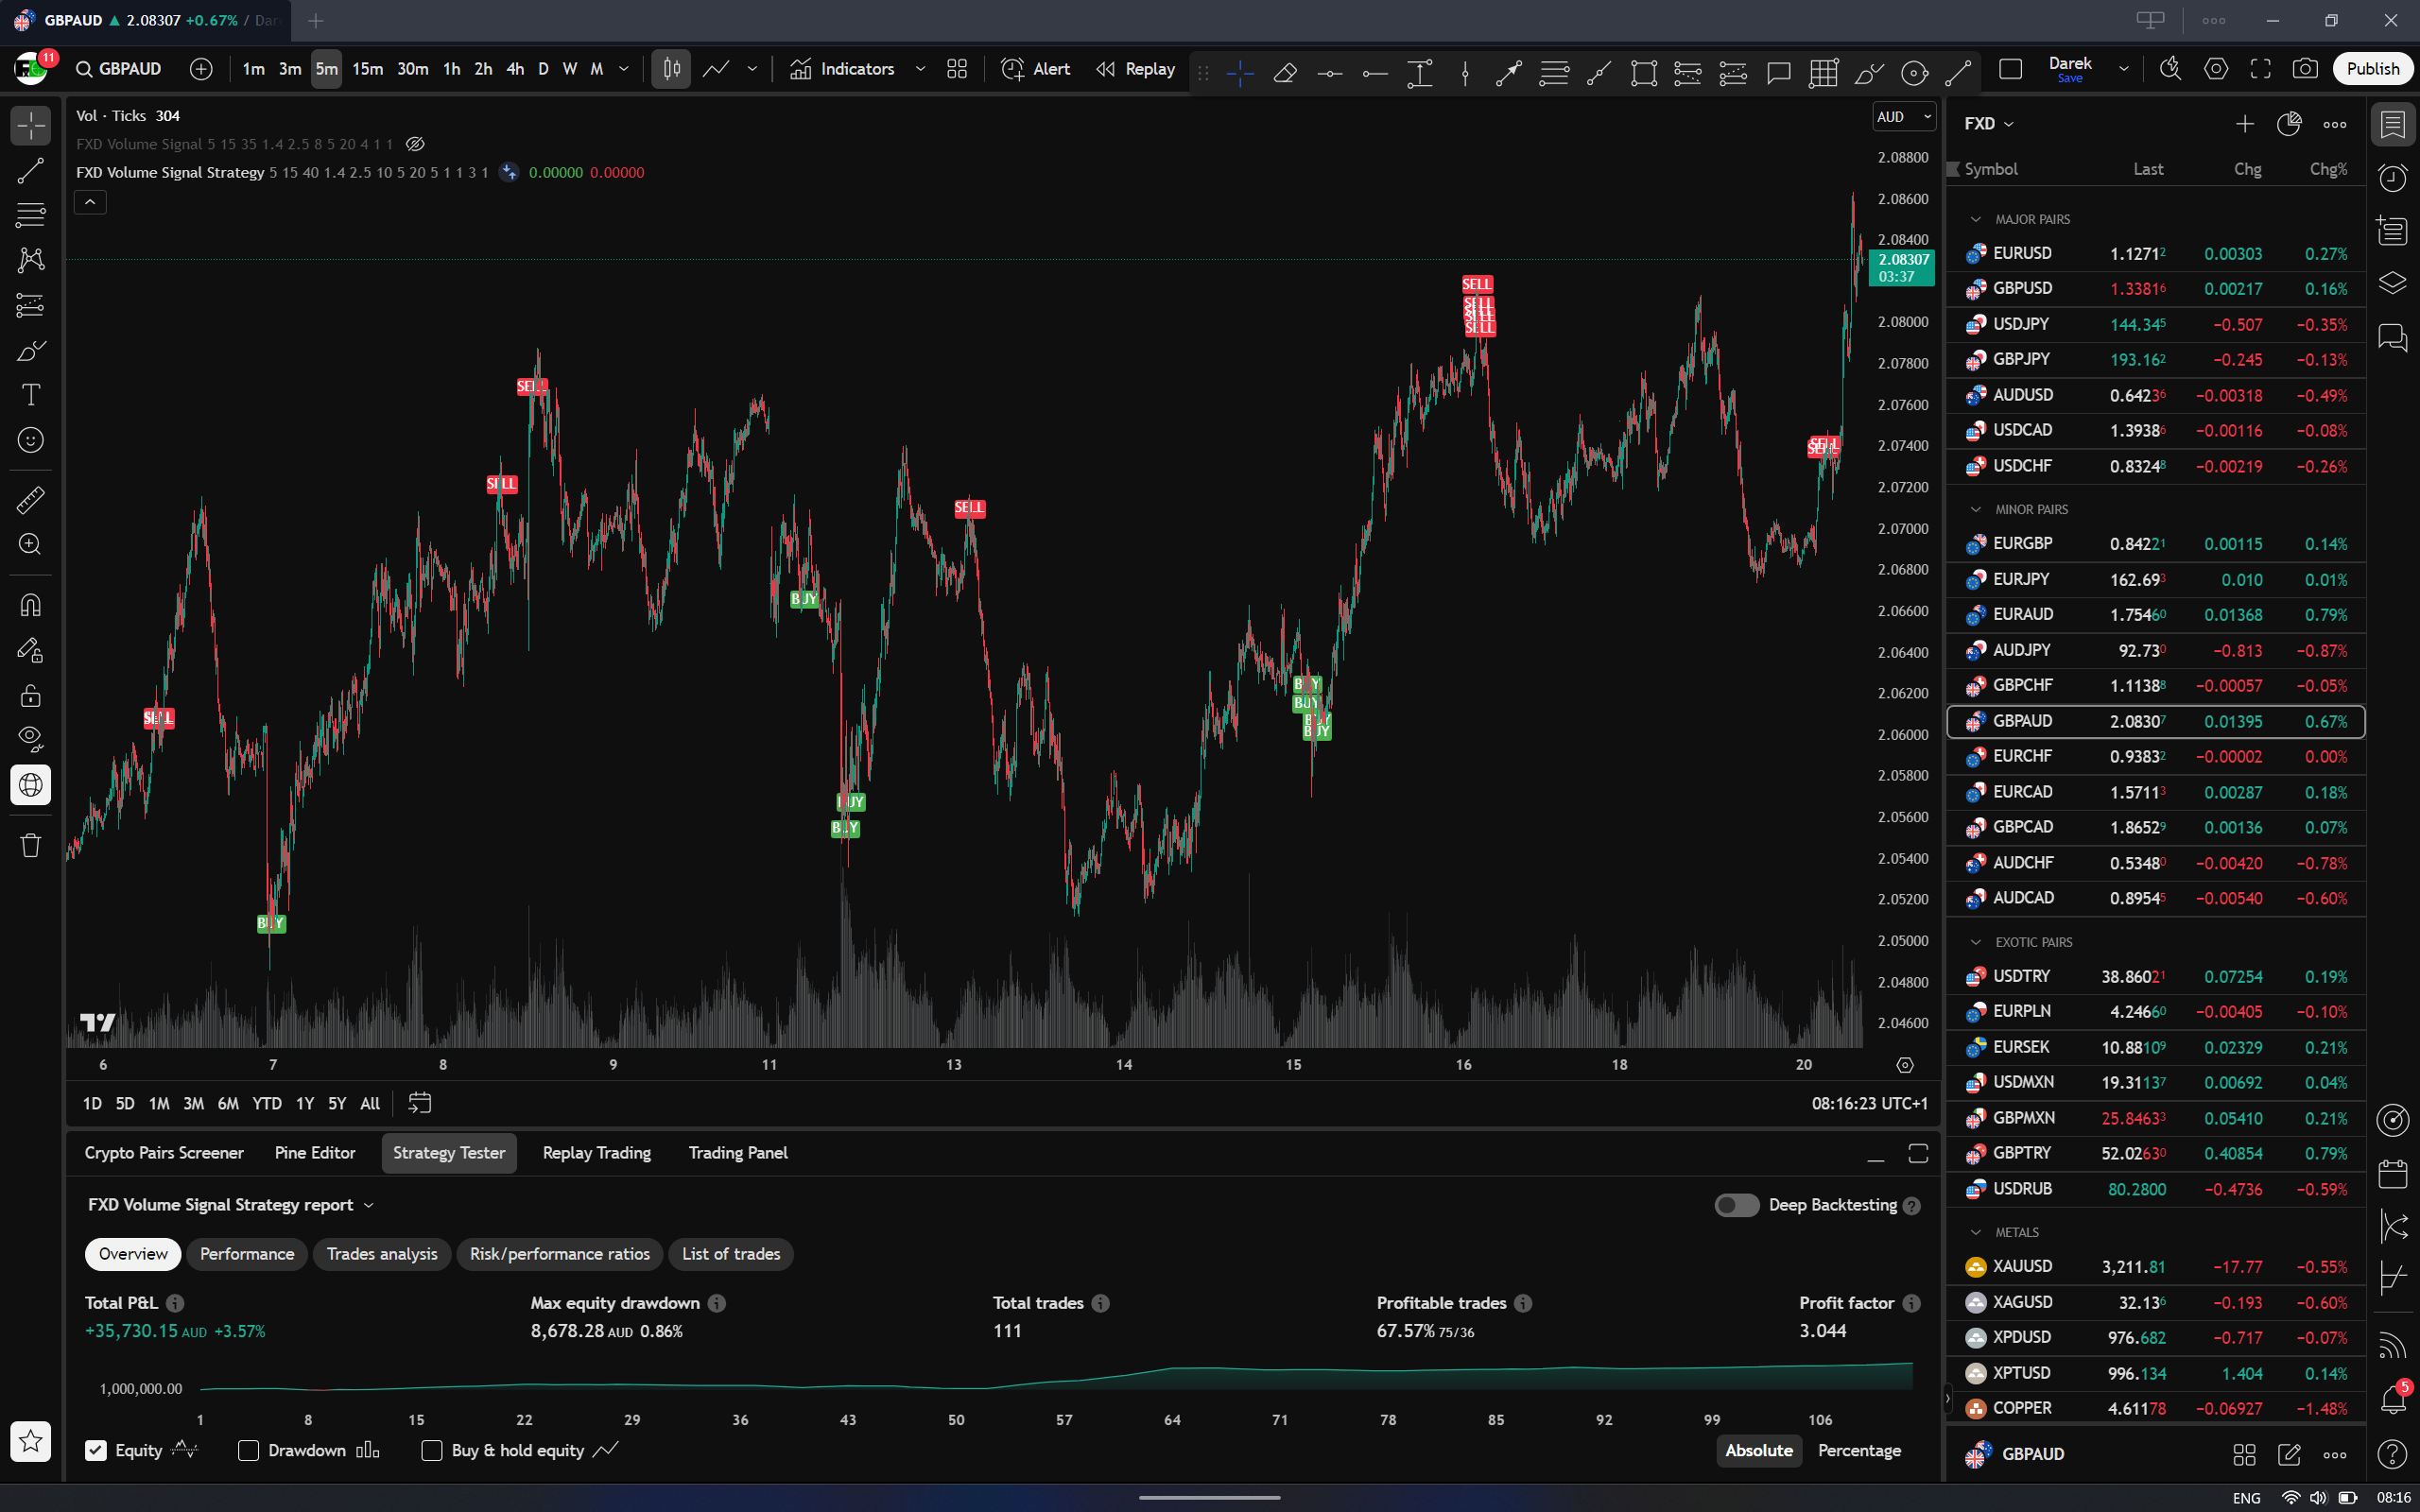
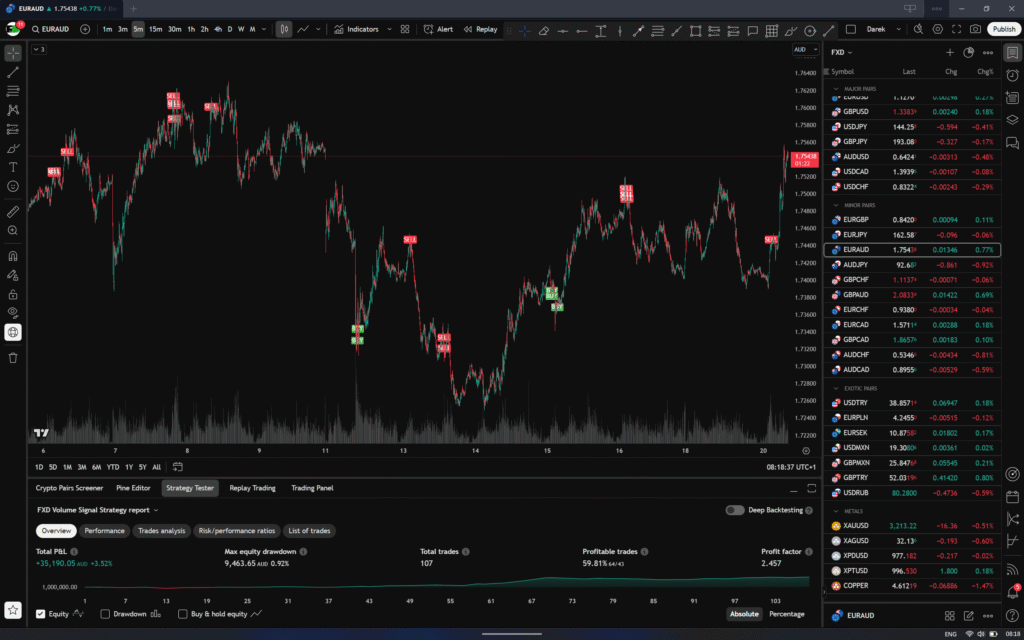
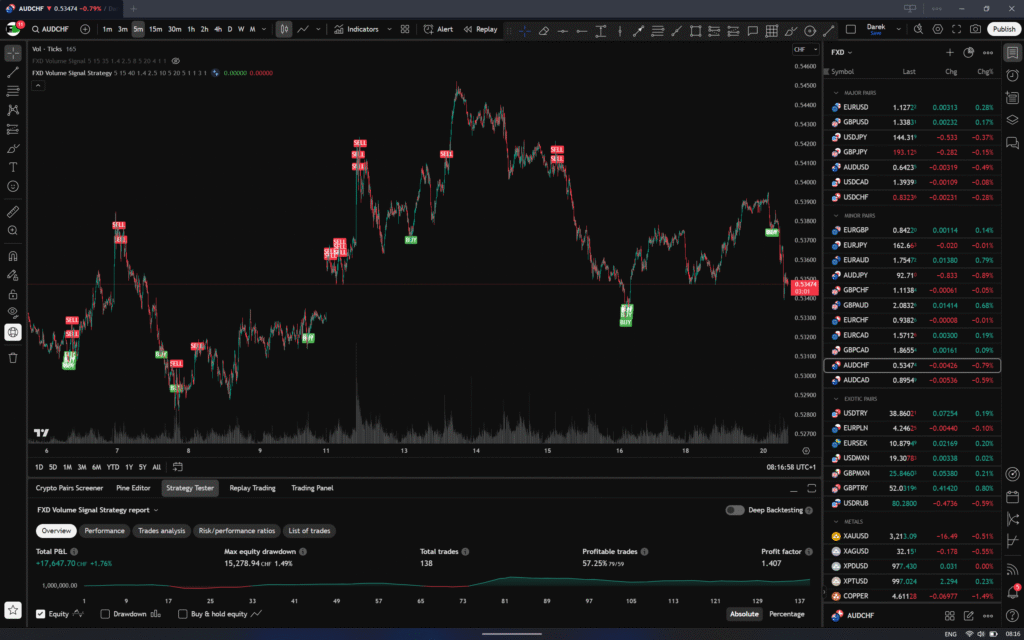
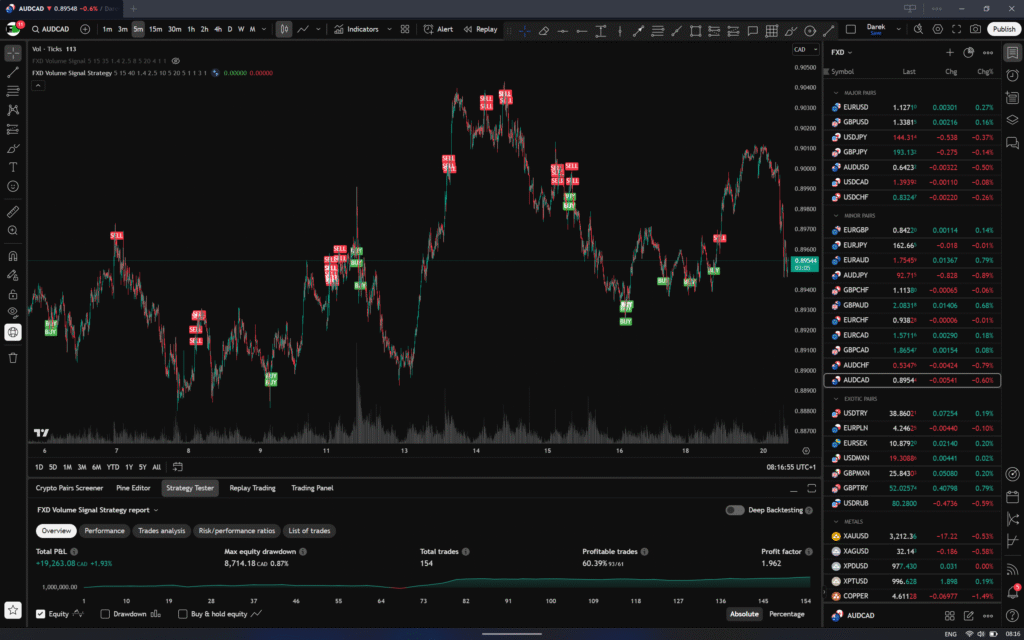
An average result of the TradingView’s Strategy Tester gives our indicator a 60% profitable trade score and a 2.0 profit factor.
Keep in mind, an indicator is just a tool, it doesn’t have a brain. These number could be easily increased with manual trade adjustments, adding your own confluences and using your own trading experience to manage the trades and their risk.
Video Introduction to our Indicator
Reminder! An indicator will not make you profitable. It’s just a tool that can help you pick better trades but how you manage your trades and your risk is your responsibility.