The concept of using premium and discount zones is probably the least popular concept in all of SMC. Which is very surprising as it’s one of the easiest ways to find better entries and limit your losses.
The basic idea of premium and discount zones is buying an asset when the price is in your discount zone and selling it when the price is in your premium zone.
In trading, premium and discount zones refer to specific price levels relative to an asset’s current market price. These zones are often observed in the context of technical analysis, where traders analyze price charts to identify potential support and resistance levels. Here’s a breakdown of each:
- Premium Zone:
- The premium zone typically refers to price levels above the current market price of an asset.
- In an uptrend, when the price of an asset is rising, the premium zone represents price levels that are considered relatively expensive or overvalued compared to recent market activity.
- Traders may view the premium zone as a potential area of resistance, where selling pressure could increase as traders look to take profits or initiate short positions.
- The premium zone may also be associated with psychological levels or Fibonacci retracement levels that have historical significance in price action.
- Discount Zone:
- The discount zone, on the other hand, refers to price levels below the current market price of an asset.
- In a downtrend, when the price of an asset is falling, the discount zone represents price levels that are considered relatively cheap or undervalued compared to recent market activity.
- Traders may view the discount zone as a potential area of support, where buying interest could increase as traders perceive the asset as being attractively priced.
- Like the premium zone, the discount zone may also be associated with psychological levels or Fibonacci retracement levels that have historical significance.
Our members already secured 7-figures in funding capital. Join the FXD Academy and take your trading to the next level, click here to learn more.
Traders often use premium and discount zones in conjunction with other technical analysis strategies such as supply and demand, market structure analysis, liquidity concepts or other SMC styles, to identify potential entry and exit points for trades. For example, a trader might look to enter a long position near the lower boundary of the discount zone in anticipation of a bounce higher if they believe the asset is oversold. Conversely, they might consider selling or shorting near the upper boundary of the premium zone if they anticipate a reversal or pullback in the uptrend. These zones can provide valuable insights into market sentiment and help traders make more informed trading decisions.
How to identify premium and discount zones
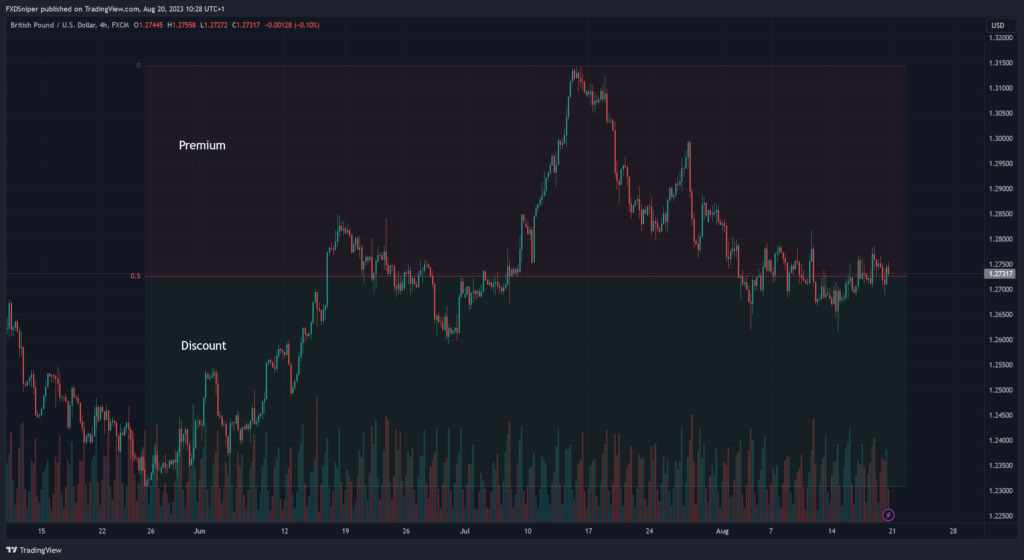
If you’ve ever used the fibonacci retracement tool, you already know how to identify your premium and discount zones because they are drawn in the exact same way. You want to select a full swing of the movement (the lowest point in price to the highest). Some of you may be wondering why we haven’t drawn the zones from the higher low at 1.25900, that’s because that’s not the full move. The price was already half way through the bullish move. You want to draw your fib tool from the start of the move to the end.
This is also why premium and discount zones work best at higher time frames. It does work on all timeframes but the higher you go the more accurate results you will get. 15 minute is the lowest timeframe I would recommend to draw your premium and discount zones but ideally you want to use 1h or 4h.
Limiting Your Losses Trading at Premium and Discount Pricing
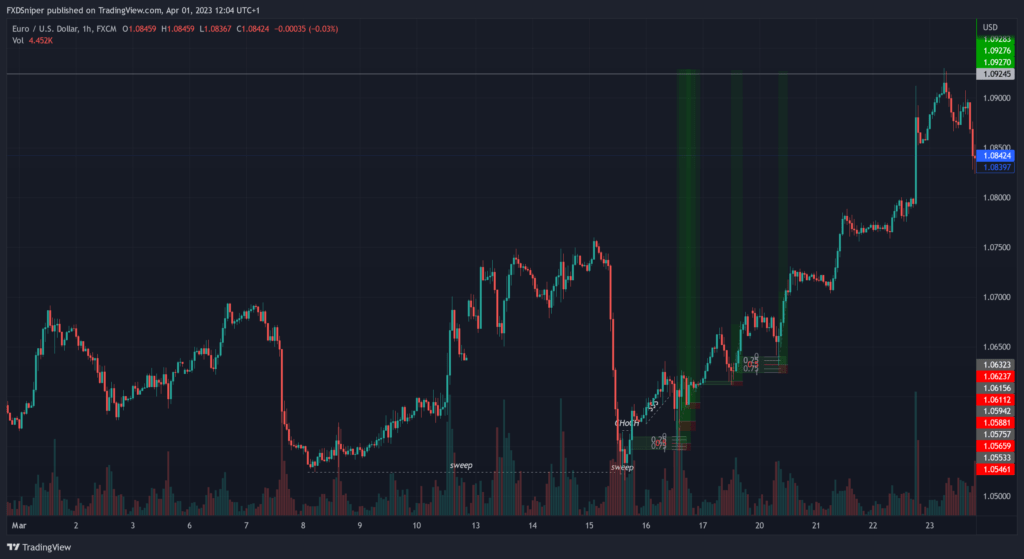
Trade with the trend. That’s what everyone keeps saying. Do you notice how many valid supply & demand and order blocks you had before price came into the discount? Thousands of trend traders would have been stopped out trying to buy early at these zones. But you were the patient one, simply waiting for the price to hit your zone inside the discount. You avoided all the losses and you’re riding out the correct wave now.
Become a VIP and get access to exclusive insights, powerful trading indicators and other resources, click here to join now.
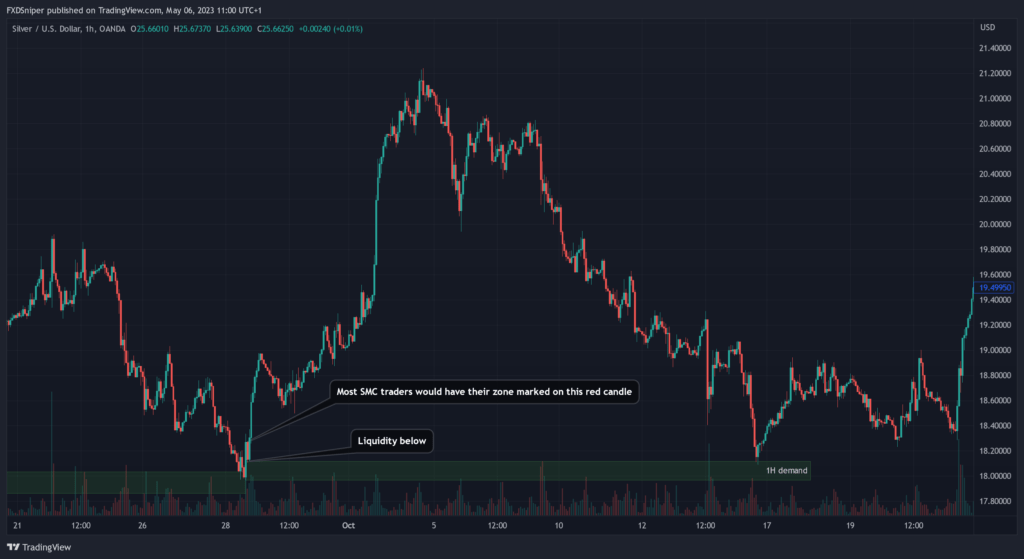
However you cannot rely just on your premium and discount areas to trade from. This is not an entry strategy, this is just something that will help you pick the correct zones and limit your losses. You should use other strategies for confluence, just like I had supply & demand zones drawn in my example, but you can use any other strategy you like.
Let me give you another example:
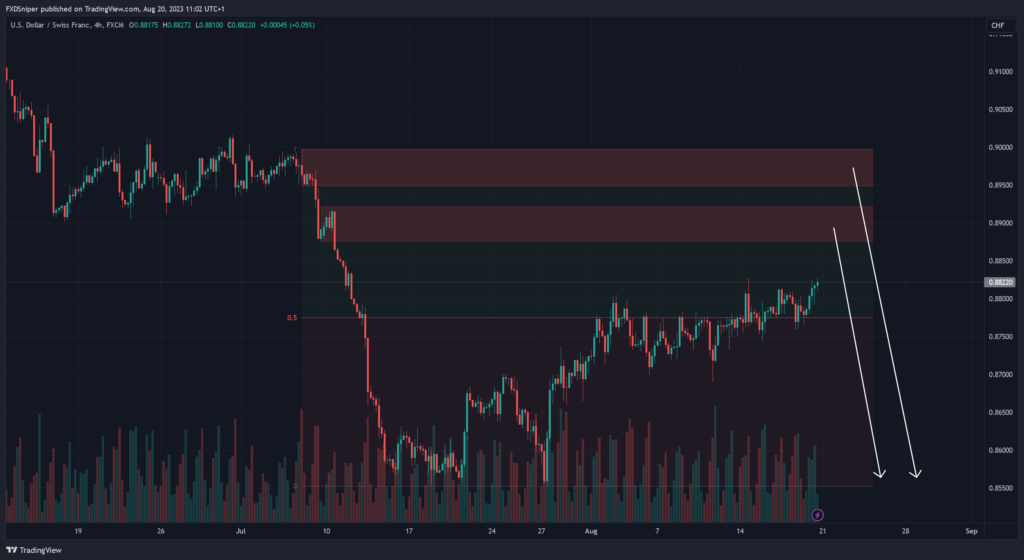
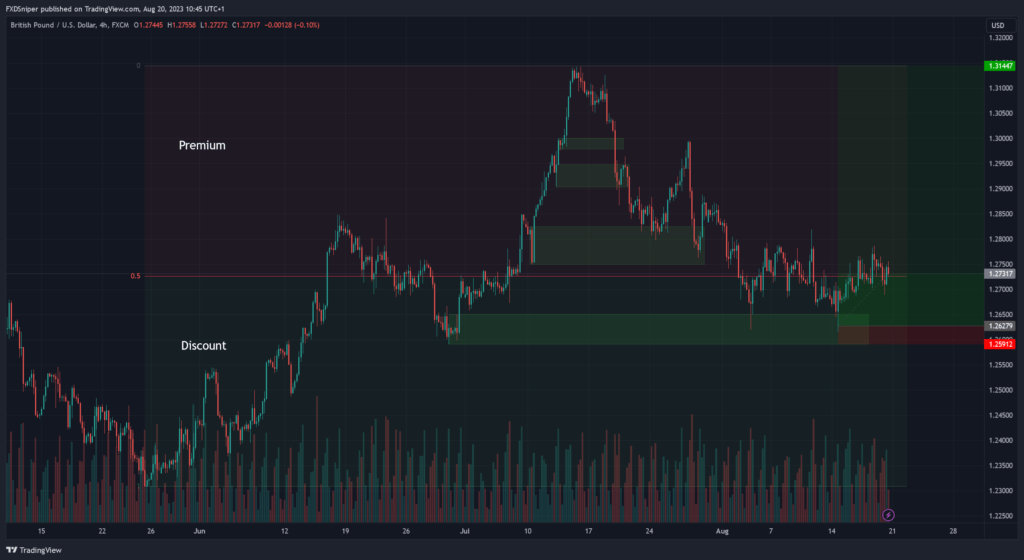
Notice how many zones are around the current price action? All that range means early sellers(trend traders) are trying to get in on the next move down and they’re all getting stopped out. We have two potential high probability zones at the top of our premium where the price is most likely to reverse from. All you have to do now is wait for lower time frame confirmation and execute the sells. It’s that simple.
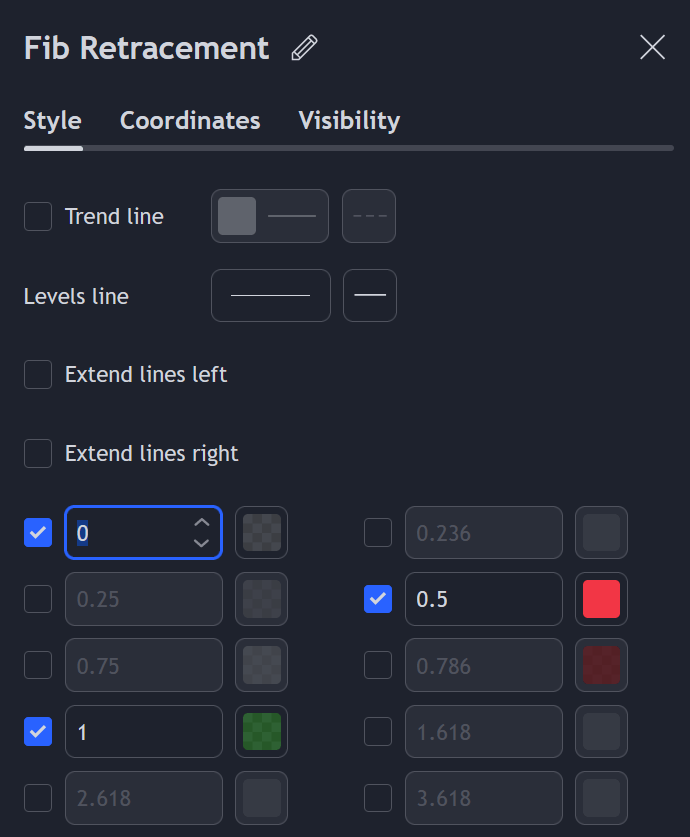
How to edit the fibonacci retracement tool for premium and discount.
All you need is to select the 0, 0.5 and 1 levels and turn off everything else, the colours you choose are not important you can turn that off too.
Leading broker 16+ years in the industry
Spreads starting from 0.0 pips
Up to 1:2000 leverage
Trade Forex, Futures, Stocks and Commodities
Instant withdrawals get paid in under a minute
To Summaraise
- Buy only at a discount, sell only at a premium.
- Use other strategies for confluence.
- Premium and Discount pricing works best at higher timeframes.
- Mark your zones from the lowest point in price to the highest.