The most misused and misunderstood word in the forex space is “liquidity”. The holy grail in forex does not exist, but if I could name one thing that gets very close to it I would say it’s liquidity. It’s the ability to spot areas where the big money flows in the market and riding the wave with them.
Most traders and most of your “gurus” on the internet tell you the big money boys aka the banks and institutions hunt your stop losses to grab the extra liquidity to push price in a certain direction, but the truth is nobody cares about your 0.1 lots short on gold. Retail traders like me and you only make up around 5% of the total liquidity in the entire forex market, you must be delusional if you believe the other 95% of the market is hunting your stop losses. But I guess that’s the easier explanation rather than admitting you’re just bad at trading.
What moves the forex markets?
You enter a trade and it goes in your direction, suddenly price reverses and takes you out just to reverse again and hit your take profit. Sound familiar? Most people in this case are convinced there’s some guy sitting at a desk in a bank intentionally pushing the price just to take you out and grab your 0.1 lots in liquidity, you couldn’t be any further from the truth.
Around 95% of the total forex volume is done by algorithms (EAs, bots, AIs etc.) if that’s the case there must be something these algos are programed to look for to target these specific areas in the market which just happens to be the same area most people place their stop losses.
As a top level retail trader you may be trading with 100-500 lots with this kind of volume you can simply enter your trade whenever you want and it will be filled instantly. As an institution you’re looking to enter with 10,000 or 100,000 lots, they simply cannot enter the market like me or you, they need huge amounts of volume to fill their orders. The only way for them to trigger the extra liquidity is to push the price into specific areas where huge amounts of orders are rested.
There are buy orders below support and there are sell orders above resistance.
Become a VIP and get access to exclusive insights, powerful trading indicators and other resources, click here to join now.
How to think like an algo?
Once you actually acknowledge the fact that almost all trading in forex is automated and understand what the goal of these algos is your trading will get a whole lot easier.
You can either trade with the liquidity or you can become the liquidity the choice is yours. To avoid becoming the liquidty you must enter your trades above or below all areas of liquidity.
Let me give you an example.
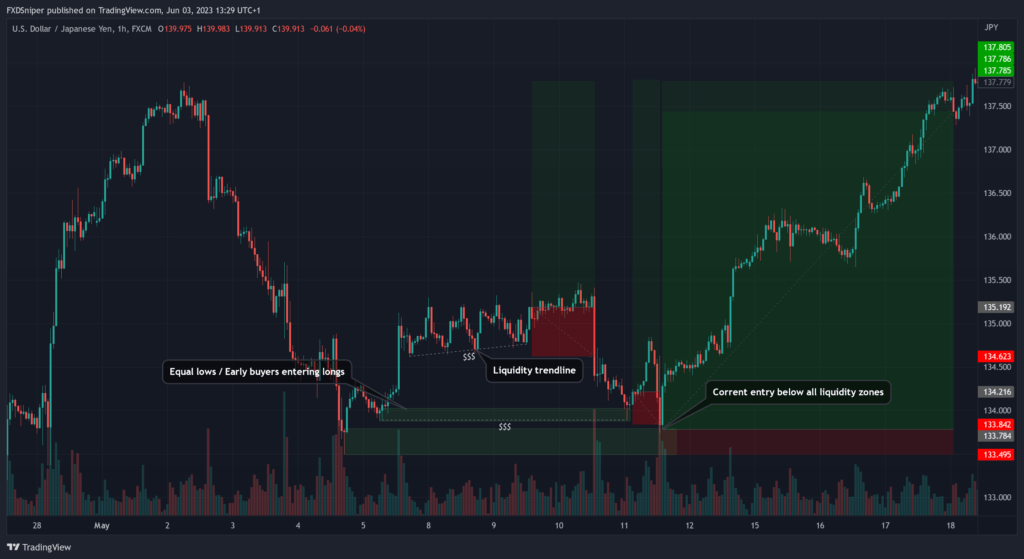
Most traders: We have an uptrend, price retested support and made a big engulfing candle to the upside. Bullish flag is forming and we have a trendline, it’s time to buy! SL hit.
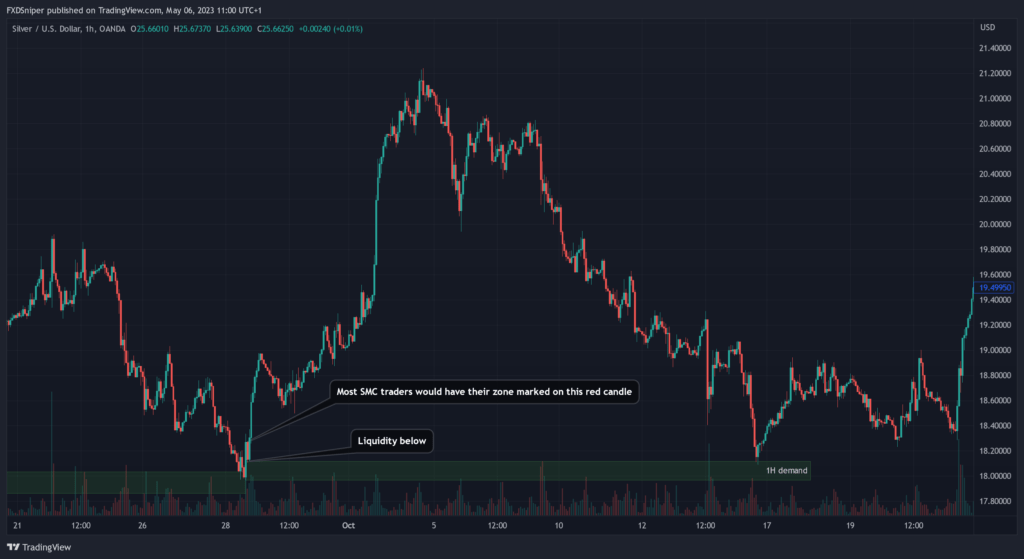
Most SMC traders: We have an uptrend, price retested the lowest demand zone and changed character. Trendline liquidity is forming, I’m buying at the next demand zone below liquidity! SL hit.
Me: We have an uptrend, price retested the lowest demand zone and changed character. All I see is liquidity that needs to be taken out, I will enter right below at the lowest demand zone. TP hit.
Do you see how all of the liquidity had to be taken out before price actually made the move everyone was waiting for?
How to identify liquidity zones
In order to understand areas of liquidity in the markets you must understand its market structure otherwise you will get overwhelmed and confused because most “liquidity grabs” break the market structure on smaller timeframes so you have to know when the market actually shifts its bias and when it’s simply grabbing more liquidity to push the price.
There are 2 main way to identify liquidity using SMC concepts. You have a liquidity that forms in a trend line and you have liquidity that forms as a range.
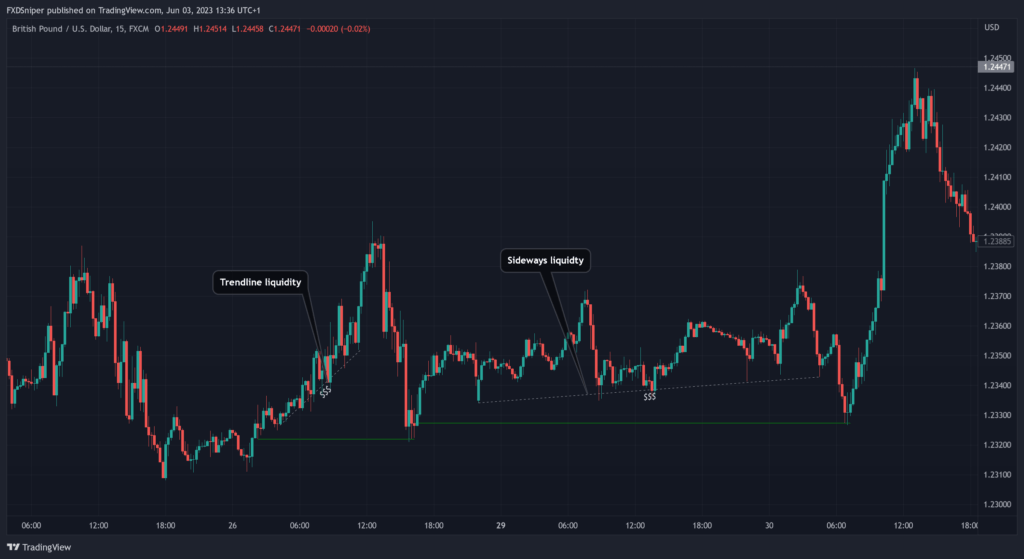
Notice how each time the liquidity was taken out it looked as if price broke the structure. Most traders would get trapped in this scenario thinking price will continue to go down. That’s why you must understand higher timeframe structure to make sure you know your bias.
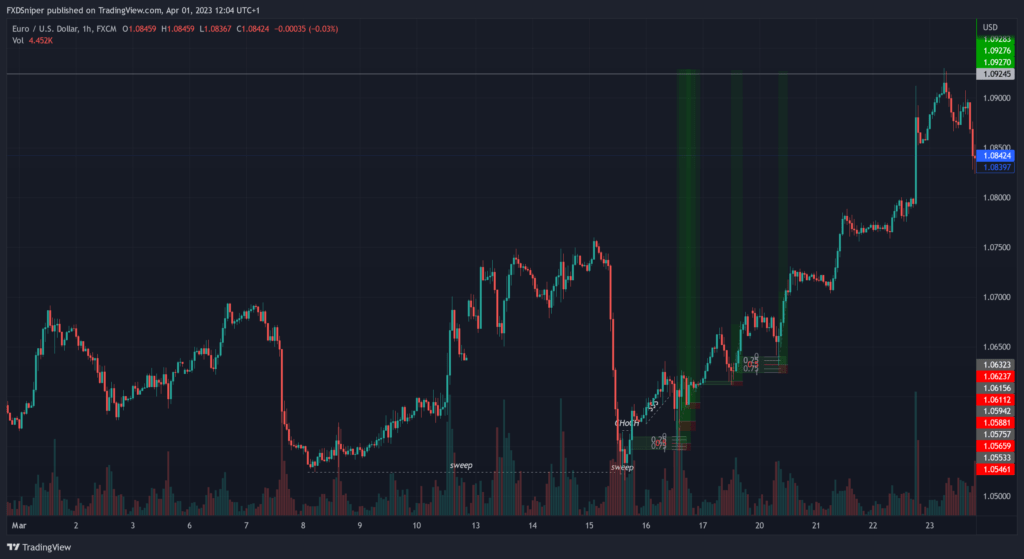
If you’ve been following me for a while you have definitely seen my green sniper lines, but nobody seems to know what they mean. Well it is a secret and it’s still something I’m working on myself, maybe one day I will write a full article about it when I can actually say I’ve mastered it, but for now all I will say is wicks and candles have meanings. The green line simply means there’s liquidity there based on analysing the market structure and supply and demand.
I will give you one more example just with my green lines.
Our members already secured 7-figures in funding capital. Join the FXD Academy and take your trading to the next level, click here to learn more.
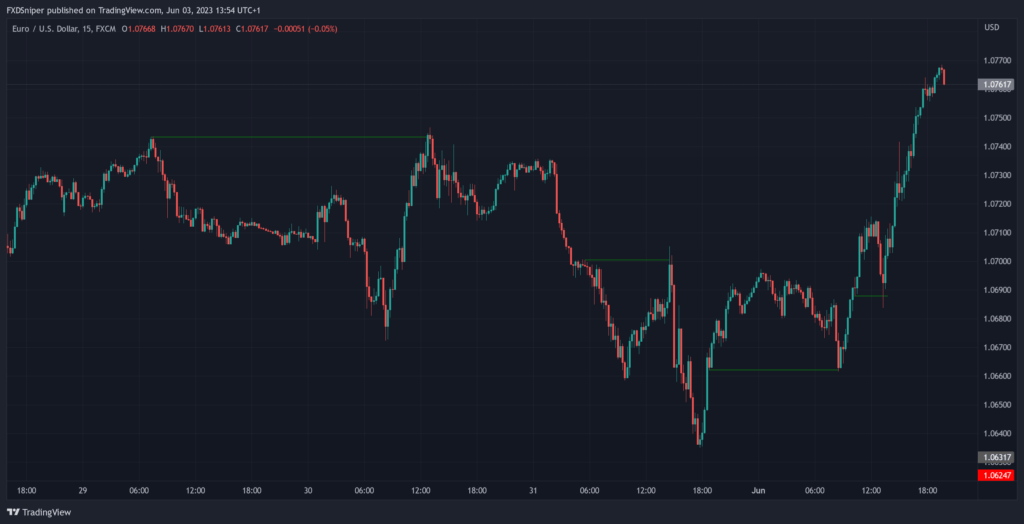
Some of these entries have been posted in my signals channel so it’s not something that has been marked on an old chart. See how every time price made a strong move it broke structure grabbing liquidity?
This is a very advanced way of analysing areas of liquidity, so if you’re new to this you should probably just stick with my previous examples and use supply and demand to find your entries once the liquidity has been taken out.
This works on every single timeframe, but as always the higher timeframe has the strongest confluence.
Everybody’s favourite chart, Bitcoin.
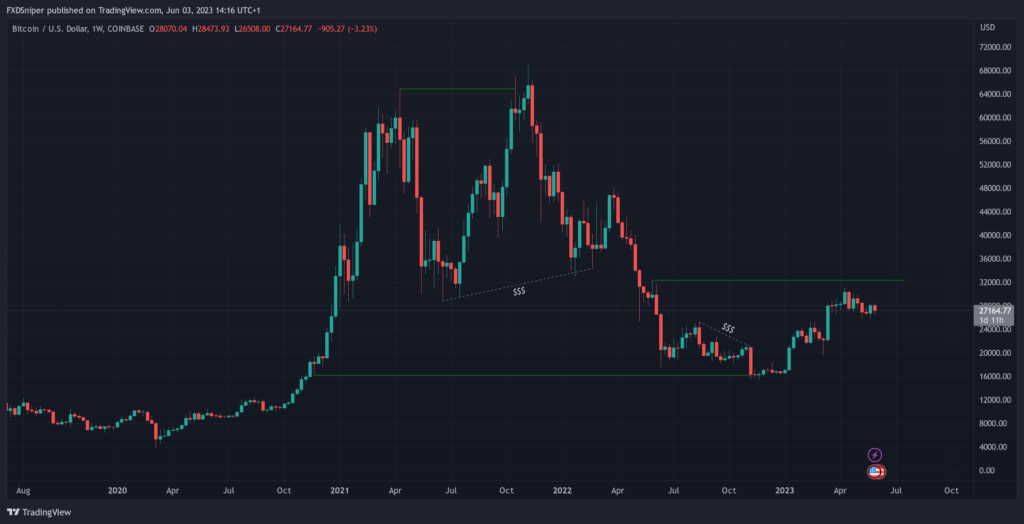
Remember when Bitcoin broke $65k and everyone was screaming we’re going to 100k? Yeah, what actually happened was price took out all the early sellers at the same time trapping all the buyers just to push the price all the way down, below all the liquidity stopping at $15k just where the last liquidity rested based on supply and demand.
What’s happening now? After we took out the liquidity at $16k we reversed taking out all the sellers at $20-24k who were screaming we’re going down to $12k. Where do you think we’re most likely to reverse now? Bitcoin turned bullish, people are buying, but there’s liquidity resting at $32k, so we’re probably going to take that out and then push the price to $12k. See the pattern?
The markets are always looking to take out both sides, your job is to know where the battle between the bulls and bears take place so you can join the winning team.
Leading broker 16+ years in the industry
Spreads starting from 0.0 pips
Up to 1:2000 leverage
Trade Forex, Futures, Stocks and Commodities
Instant withdrawals get paid in under a minute
To Summarise
- 95% of total forex volume is performed by algorithms.
- Markets are always looking to grab liquidity before making its move.
- Enter trades only below/above liquidity zones.
- You must understand market structure to identify liquidity correctly.
- Use supply and demand for extra confluence for your entries.