How often do you get ready to do your analysis, you open up your charts and you just don’t know where to even begin because it looks like a random mess of candles? Well, in this article I will show you a simple way to get rid of all the noise and focus on sets of candles that actually matter.
Let’s say you open up your chart and it looks like this:
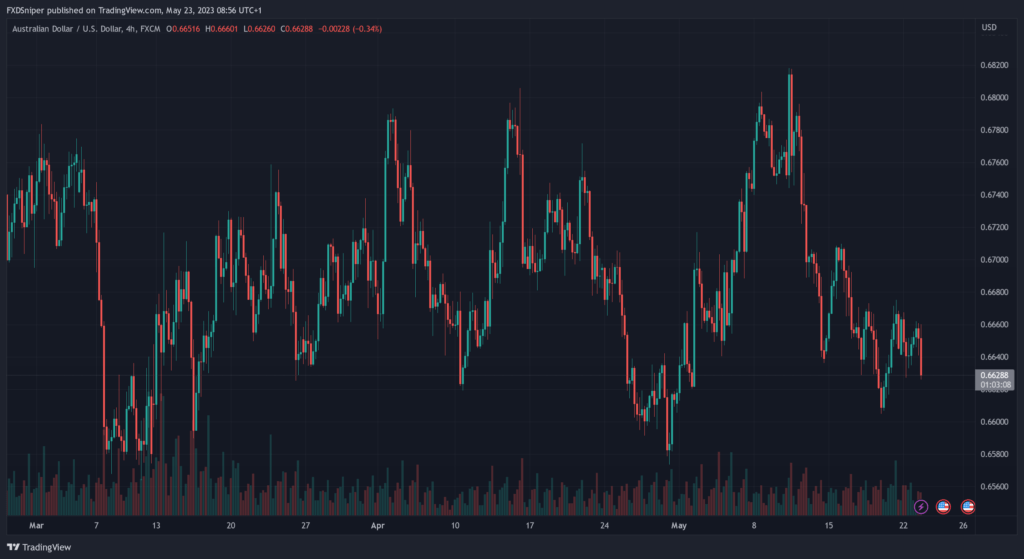
It looks like a mess, there’s no clear indication where price is going. Most people wouldn’t even know where to begin analysing a chart like this. So I will let you in on a little secret indicator you can use, it’s called “Multi-Time Period Charts” on TradingView and what it does it creates boxes around candles set to a specific timeframe.
Make sure you select “weekly” timeframe and remove “auto timeframe“.
And your chart will turn into this:
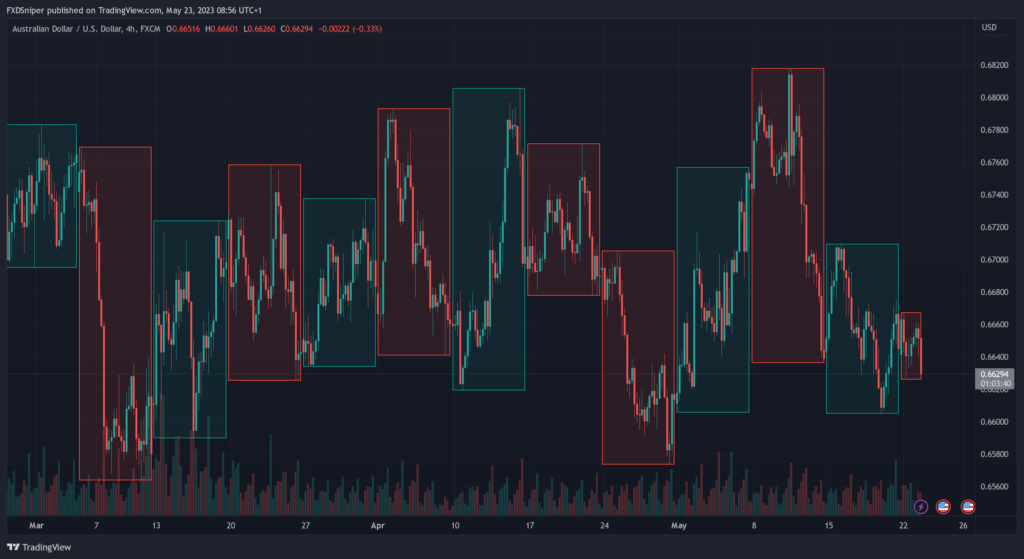
Now each box on the chart represents one weekly candle, obviously the color of the box is also the color of the weekly candle. What this does is it selects each week’s candles and puts a box around it and as you go down or up in timeframe the box stays there.
Our members already secured 7-figures in funding capital. Join the FXD Academy and take your trading to the next level, click here to learn more.
So now instead of having to analyse the entire chart going back months you just focus on one or two of the boxes and ignore the rest. If you’re a swing trader just set the timeframe to “monthly” or higher if you need to, but for most people weekly is ideal.
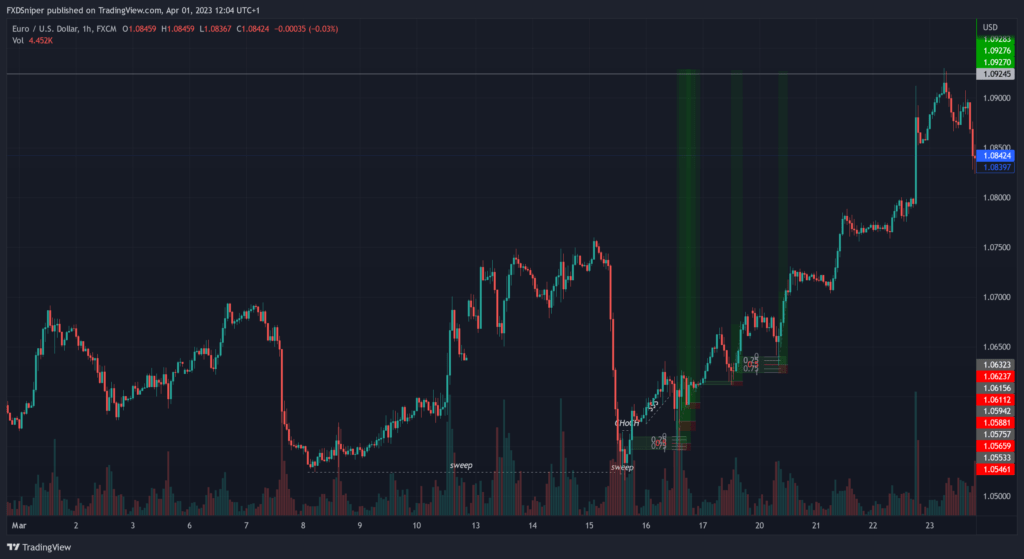
Now you can go down to a smallest timeframe, let’s say the 15min and your chart will look like this.
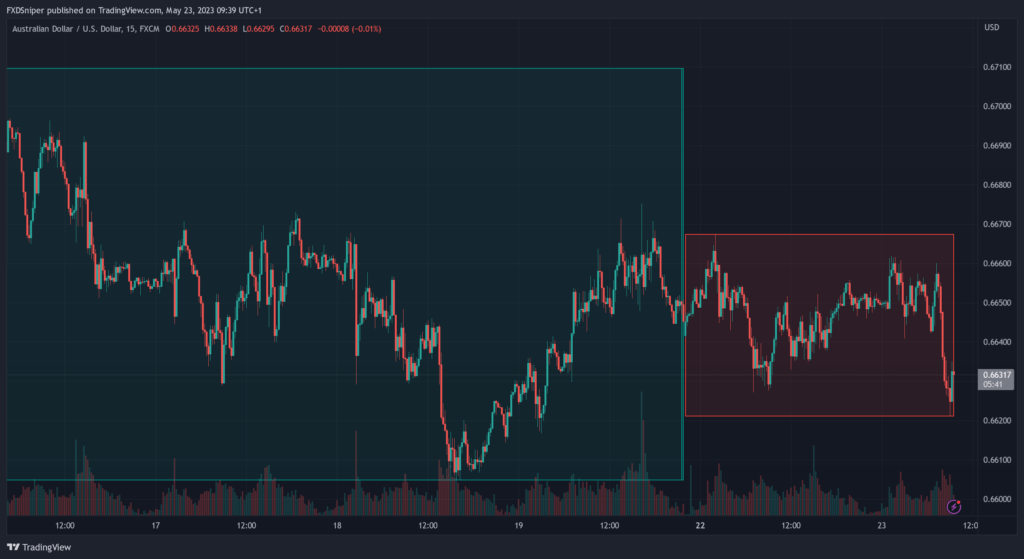
Now all you have to do is simply analyse the structure and find your zones and you’re good to go. Right off the bat I can see that price has swept the previous structure and changed character. This means we’re going down. So you locate the latest supply zone, and set your entry at 50% and target the current structure low. At this point after you’re done with your analysis you can hide the indicator by clicking the eye icon in the top left corner, you don’t need to keep it on at all times.
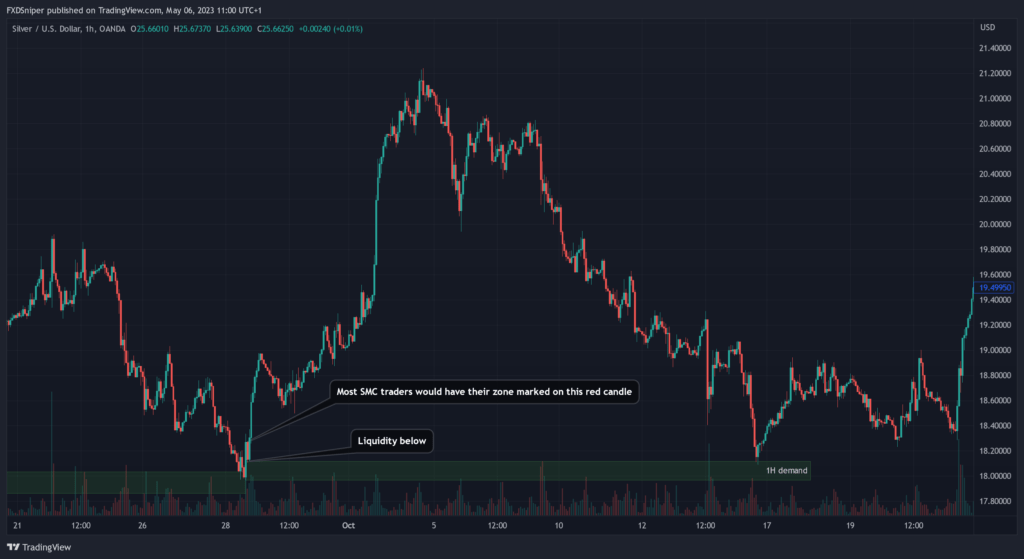
And this is what you’re left with:
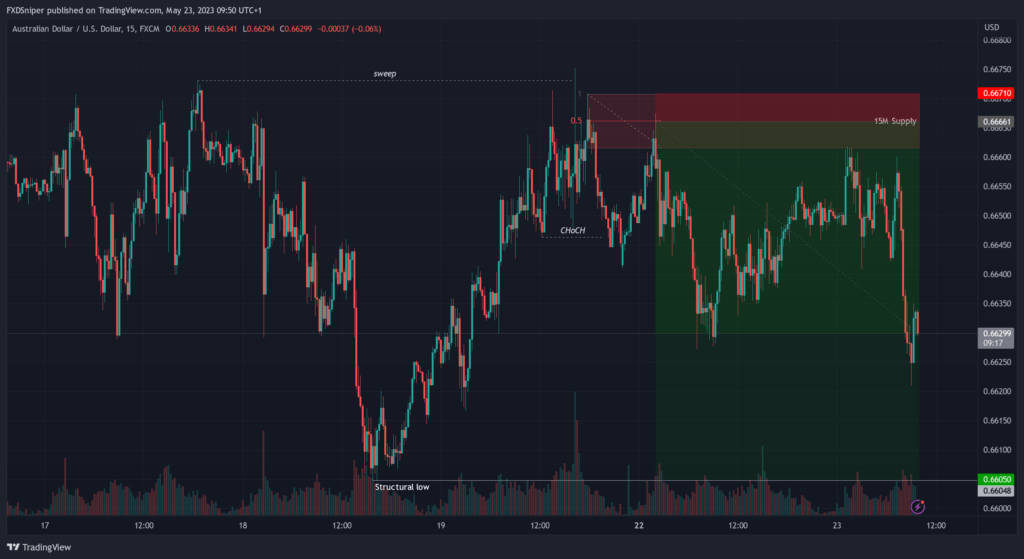
This is a 1:12.5RR trade. Of course as you get more experienced you’ll be using this indicator less and less as you’ll naturally be able to spot these areas and filter out the noise but for most people this is a very useful tool that will help you out during your day to day analysis.
Best way to use this is to analyse your chart during the weekend, mark all the important zones and structure points from the current week and when the market opens simply follow the price from the current week, don’t bother looking at 10 different timeframes everyday trying to find the perfect trades or trying to find that 1000 pip trade. Just focus on what’s there in front of you right now. There are opportunities every minute of every day in the markets you just have to learn how to read the structure and follow the price.
Leading broker 16+ years in the industry
Spreads starting from 0.0 pips
Up to 1:2000 leverage
Trade Forex, Futures, Stocks and Commodities
Instant withdrawals get paid in under a minute
To Summarise
- Find an indicator called “Multi-Time Period Charts” on TradingView.
- Set your timeframe to weekly and remove auto timeframe (use a higher timeframe if swing trading).
- Focus on 1 box at a time during your analysis.