Whether you analyse your charts on TradingView or MetaTrader you always see those little bars/candles at the bottom of your screen. That’s a volume indicator, it shows how much volume there was at each candle and most people know that, but what most people don’t know is how to read it properly. Understanding what to look for to confirm your bias or your trade using the volume indicator can significantly improve your overall win rate and allow you to hold your winning trades longer.
Identify fake moves using volume
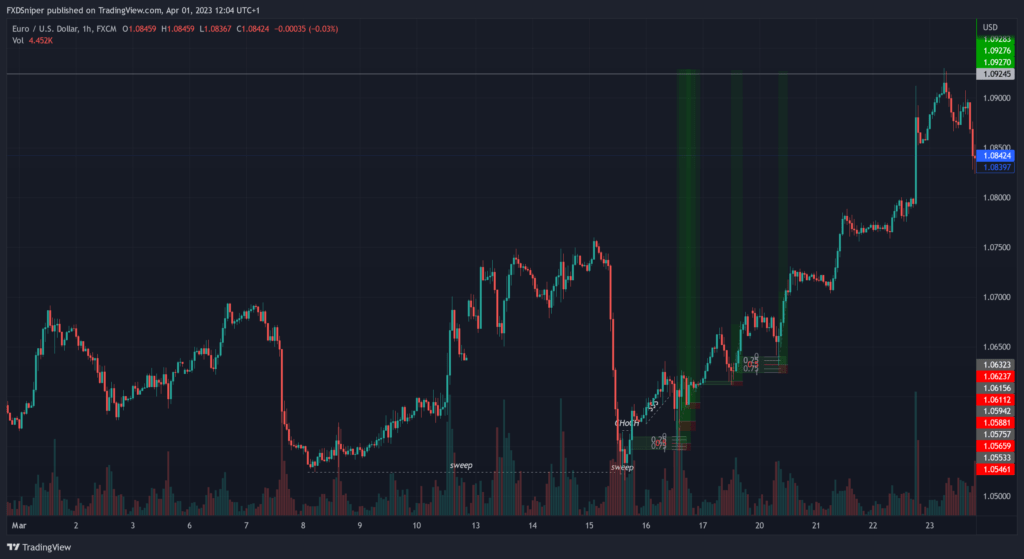
This is an example of a fake move. Notice how price created a fresh demand zone, changed character and returned into our demand to then take off breaking multiple structure points to the upside. If you saw this and you missed your trade, maybe you’d wait for a retest to jump in the trade, which wouldn’t have worked as you noticed.
Why? Look what happened before the price shoot up, or what didn’t happen. There was no volume. This means that this entire move up was simply manipulated to grab the required volume to push the price down. Notice where the real spike in volume is? It’s right at the top of the bullish move, after which the price just melts all the way down.
If you see price makes a big move without any prior spikes in volume it is most likely a fake move and the price will reverse once it reaches a key level.
Become a VIP and get access to exclusive insights, powerful trading indicators and other resources, click here to join now.
Identify real moves using volume
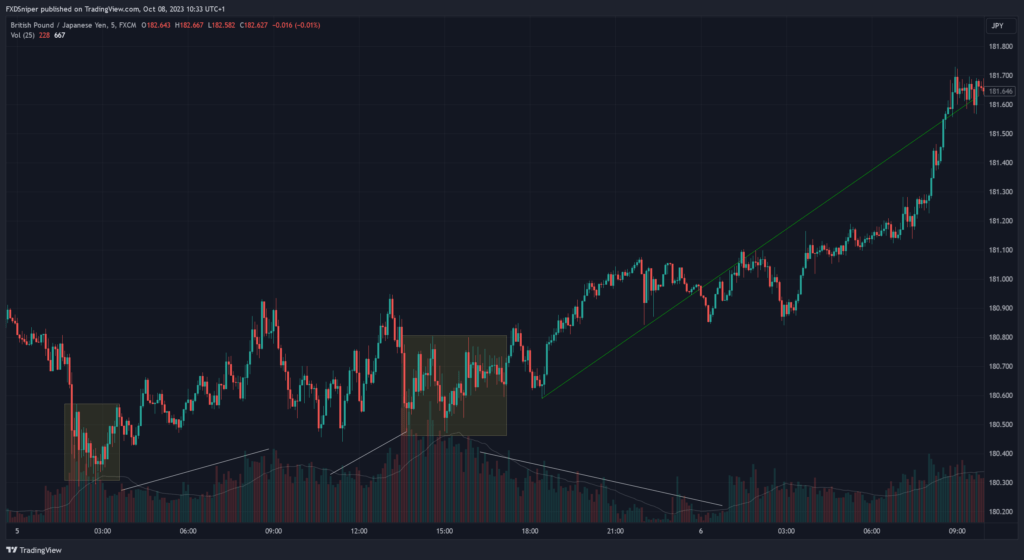
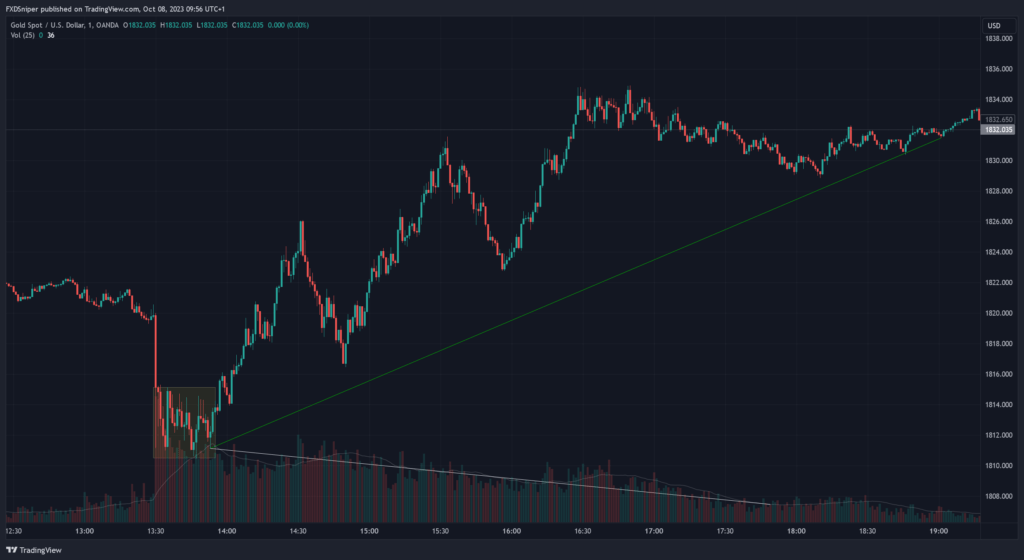
This is an example of a real move. After the initial impulse move to the downside, the price consolidated as the volume increased. Once enough orders/volume was acquired, the price moved up but the volume decreased. This happened because the majority of players exhausted their volume at the range and the price could make its move with much less volume.
There was another range where huge volume came into the market and price got stuck in this range much longer. This signals that the market makers are accumulating their orders and it gives you extra confirmation to your bias. Notice how quickly the volume goes down after the price breaks out of the range and pushes higher.
Of course you shouldn’t only rely on the volume indicator to pick your trades, this is just an extra confirmation to your original analysis.
Volume during news
If you trade during news, understanding the volume and price action as they happen can instantly make you a lot more money and stop your from losing as many trades.
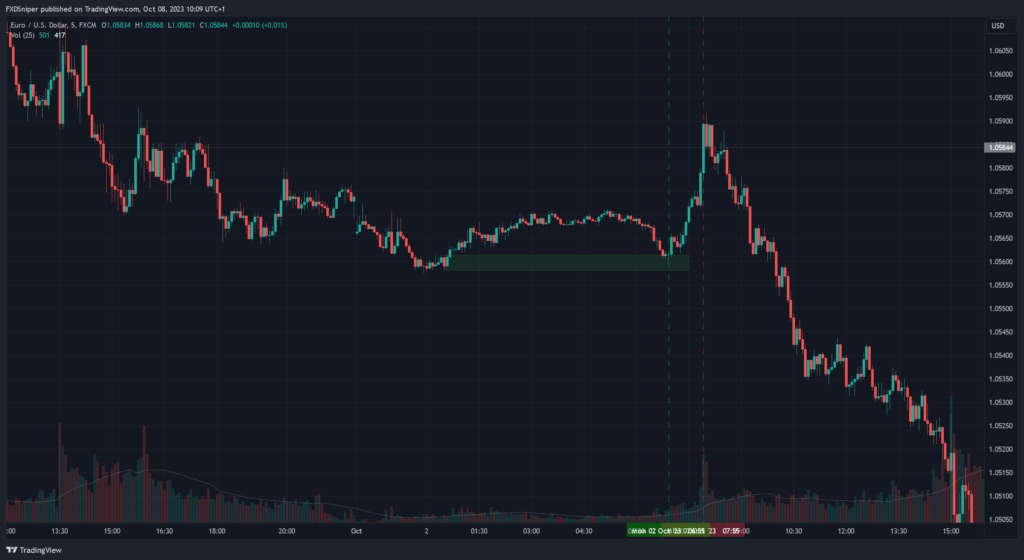
News come out, a big candle to the downside. The price stops and consolidates, notice the huge spike in volume. This means that the market makers are accumulating their orders. The price shoots up, breaking major structure points and continues higher as the volume decreases. It’s the same story as with the previous examples.
Knowing and understanding this all you have to do is follow the volume.
Leading broker 16+ years in the industry
Spreads starting from 0.0 pips
Up to 1:2000 leverage
Trade Forex, Futures, Stocks and Commodities
Instant withdrawals get paid in under a minute
To summaraise
- No volume before a big move = fake move, reversal incoming.
- Volume spike followed by a big move = real move, join on pullbacks.
- Range formation + big news volume = big move incoming.