I always say “understand the markets,” but what does it even mean? Understand the price? The candles? The pair you’re trading? What I actually mean goes much deeper than this.
I want you to look and think deeper. Who’s in control right now? Buyers or sellers? Where is the money going? What’s their goal? How do you fuel the biggest move? How are “they” making money?
Look behind the scenes. Don’t look at candles as candles. They are data points that show you the psychology and the actions of the market participants.
I don’t mean go and research where is JP Morgan, Blackrock or other financial institutions put their money into. You’ll just never know unless you have some insider information. Which doesn’t even matter.
What I mean and what I try to teach only involves the charts. You don’t have to look anywhere else. Everything you need is on your chart.
It’s not easy explaining how to think and how to look at things and this entire guide may seem chaotic at times but I’ll do my best and slowly by the end of this guide you’ll be able to at least begin to understand the markets, how they operate and how to take advantage of them and eventually use this knowledge to develop a deeper understanding, adapt to any market at any condition and become one with the markets overall.
Before we get into any chart examples, let’s start from the beginning.
Some key things to keep in mind.
- Candles don’t matter. Their shape don’t matter. How they close or open don’t matter. It’s just price.
- Price does not know time and time does not know price. The price will do whatever it wants to do regardless of what time it is.
- Price is always looking to take out both sides of liqudity before making its move.
- Markets are 100% manipulated and controlled by algorithms.
I know many of you come from an ICT background or at least studied a few of his videos. One of the main things he preaches is the London and New York timing. It’s all BS, just forget about it. Price will do whatever the price wants to do regardless of what time it is. Price only knows price.
The single thing I can agree on with ICT is that the markets are controlled by an algorithm. Not the one he created in his imaginary Minecraft world. And not a single algorithm. There are many of them, and they compete with each other to deliver the best price and make profit on top.
So when you hear people say “the institutions are buying this or selling that,” or “I trade like the banks,” it’s again all BS. Yes, the institutions, banks, and hedge funds have enough money to affect the markets, but they don’t have anywhere near the power to have any significant control.
The entire forex market is controlled by central banks. Each country with its own currency has a central bank that controls it. These banks have algorithms in place that maintain and deliver the price to the world. They can print as much money as they want, whenever they want, and they can move the price to whatever point they desire.
Of course, they don’t do that because it would collapse their own economy and potentially even the entire financial world. But they do have the power to do so in an instant, at least the biggest central banks.
What Moves The Forex Market?
We’ve already established that the markets are controlled by algorithms. But what is actually moving the markets right now at this moment?
I’m sure you often hear things like “gold is going to xxx to trigger the institutional buy orders and push up”, “xxx rejected xxx because there were a lot of sell orders there,” etc.
It’s definitely not any type of orders.
Market orders have almost zero impact on price movements.
Sure, if there’s a sell order on gold worth billions sitting at 2400, it would require a lot of liquidity to break through; so you may see a rejection there, but that’s not what actually moves the market.
Markets move because there is live money moving the markets. Meaning, market executions.
Not orders.
So if you see the price move, it’s because someone or something is currently buying or selling that asset at that very moment.
How does that impact your trading?
It doesn’t. It’s just something you should know that would further help you understand the markets and something that may allow you to make more informed decision.
Also you should keep in mind that retail trading, and institutional trading are completely seperate worlds.
Us retail traders, we can enter at any time and have our order filled instantly.
For the big players, they simply can’t do that. Their position size is so large they need to force the extra liquidity to the market for their orders to be filled. The same applies to the algos. It wouldn’t make sense for them to just move the price from A to B. They also need to make a profit, so before they make their move and enter large, they use these lower volume periods to manipulate the price where they can enter at a much favorable price.
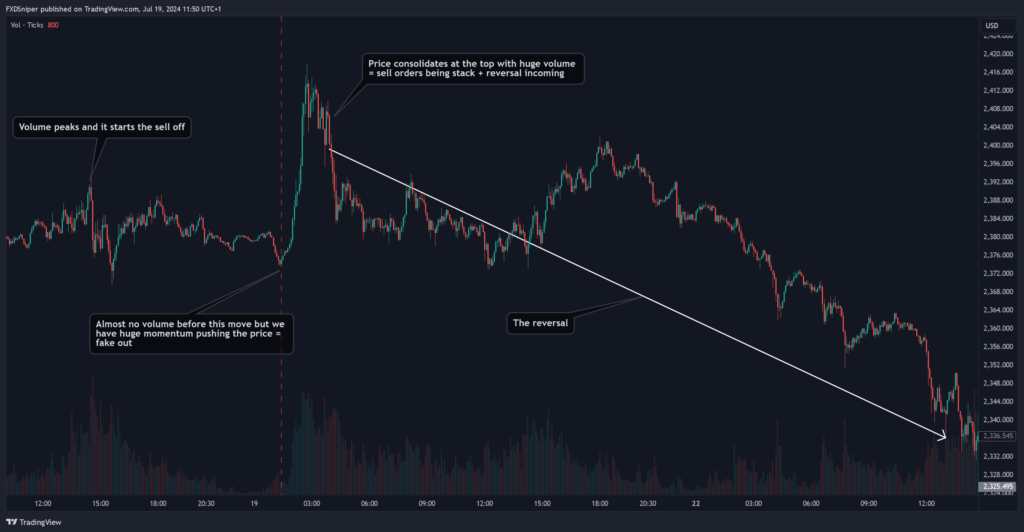
For example, if you see the price move with a strong momentum without any prior volume confirmation. It might mean that there wasn’t much liquidity in the market at that moment and those in control wanted to push the price to their desired price point to trigger the required liquidity for them to reverse the price.
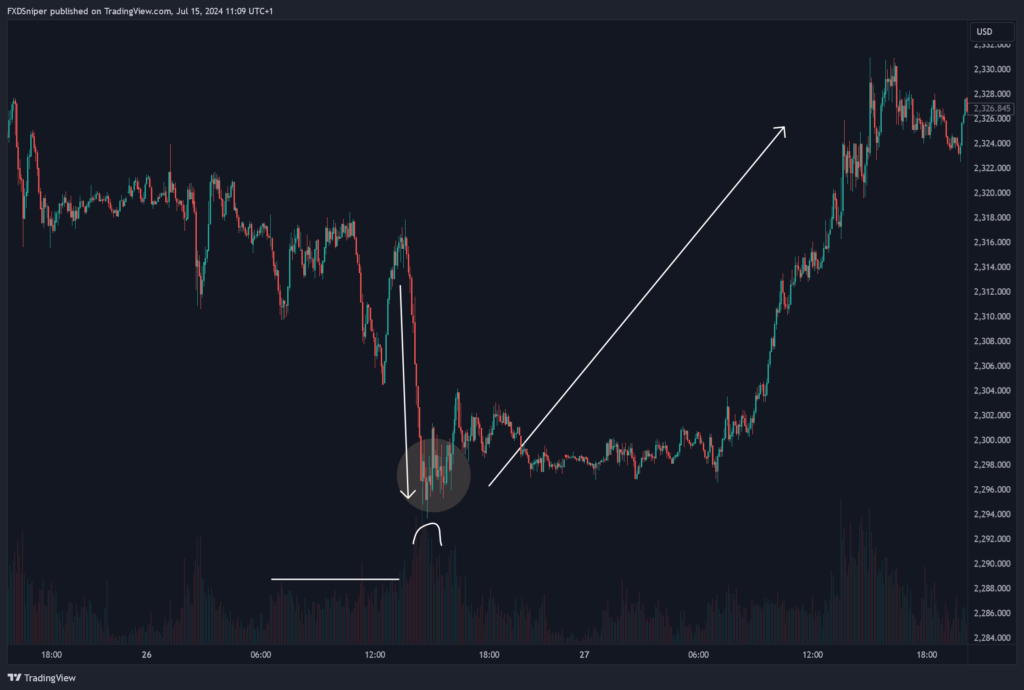
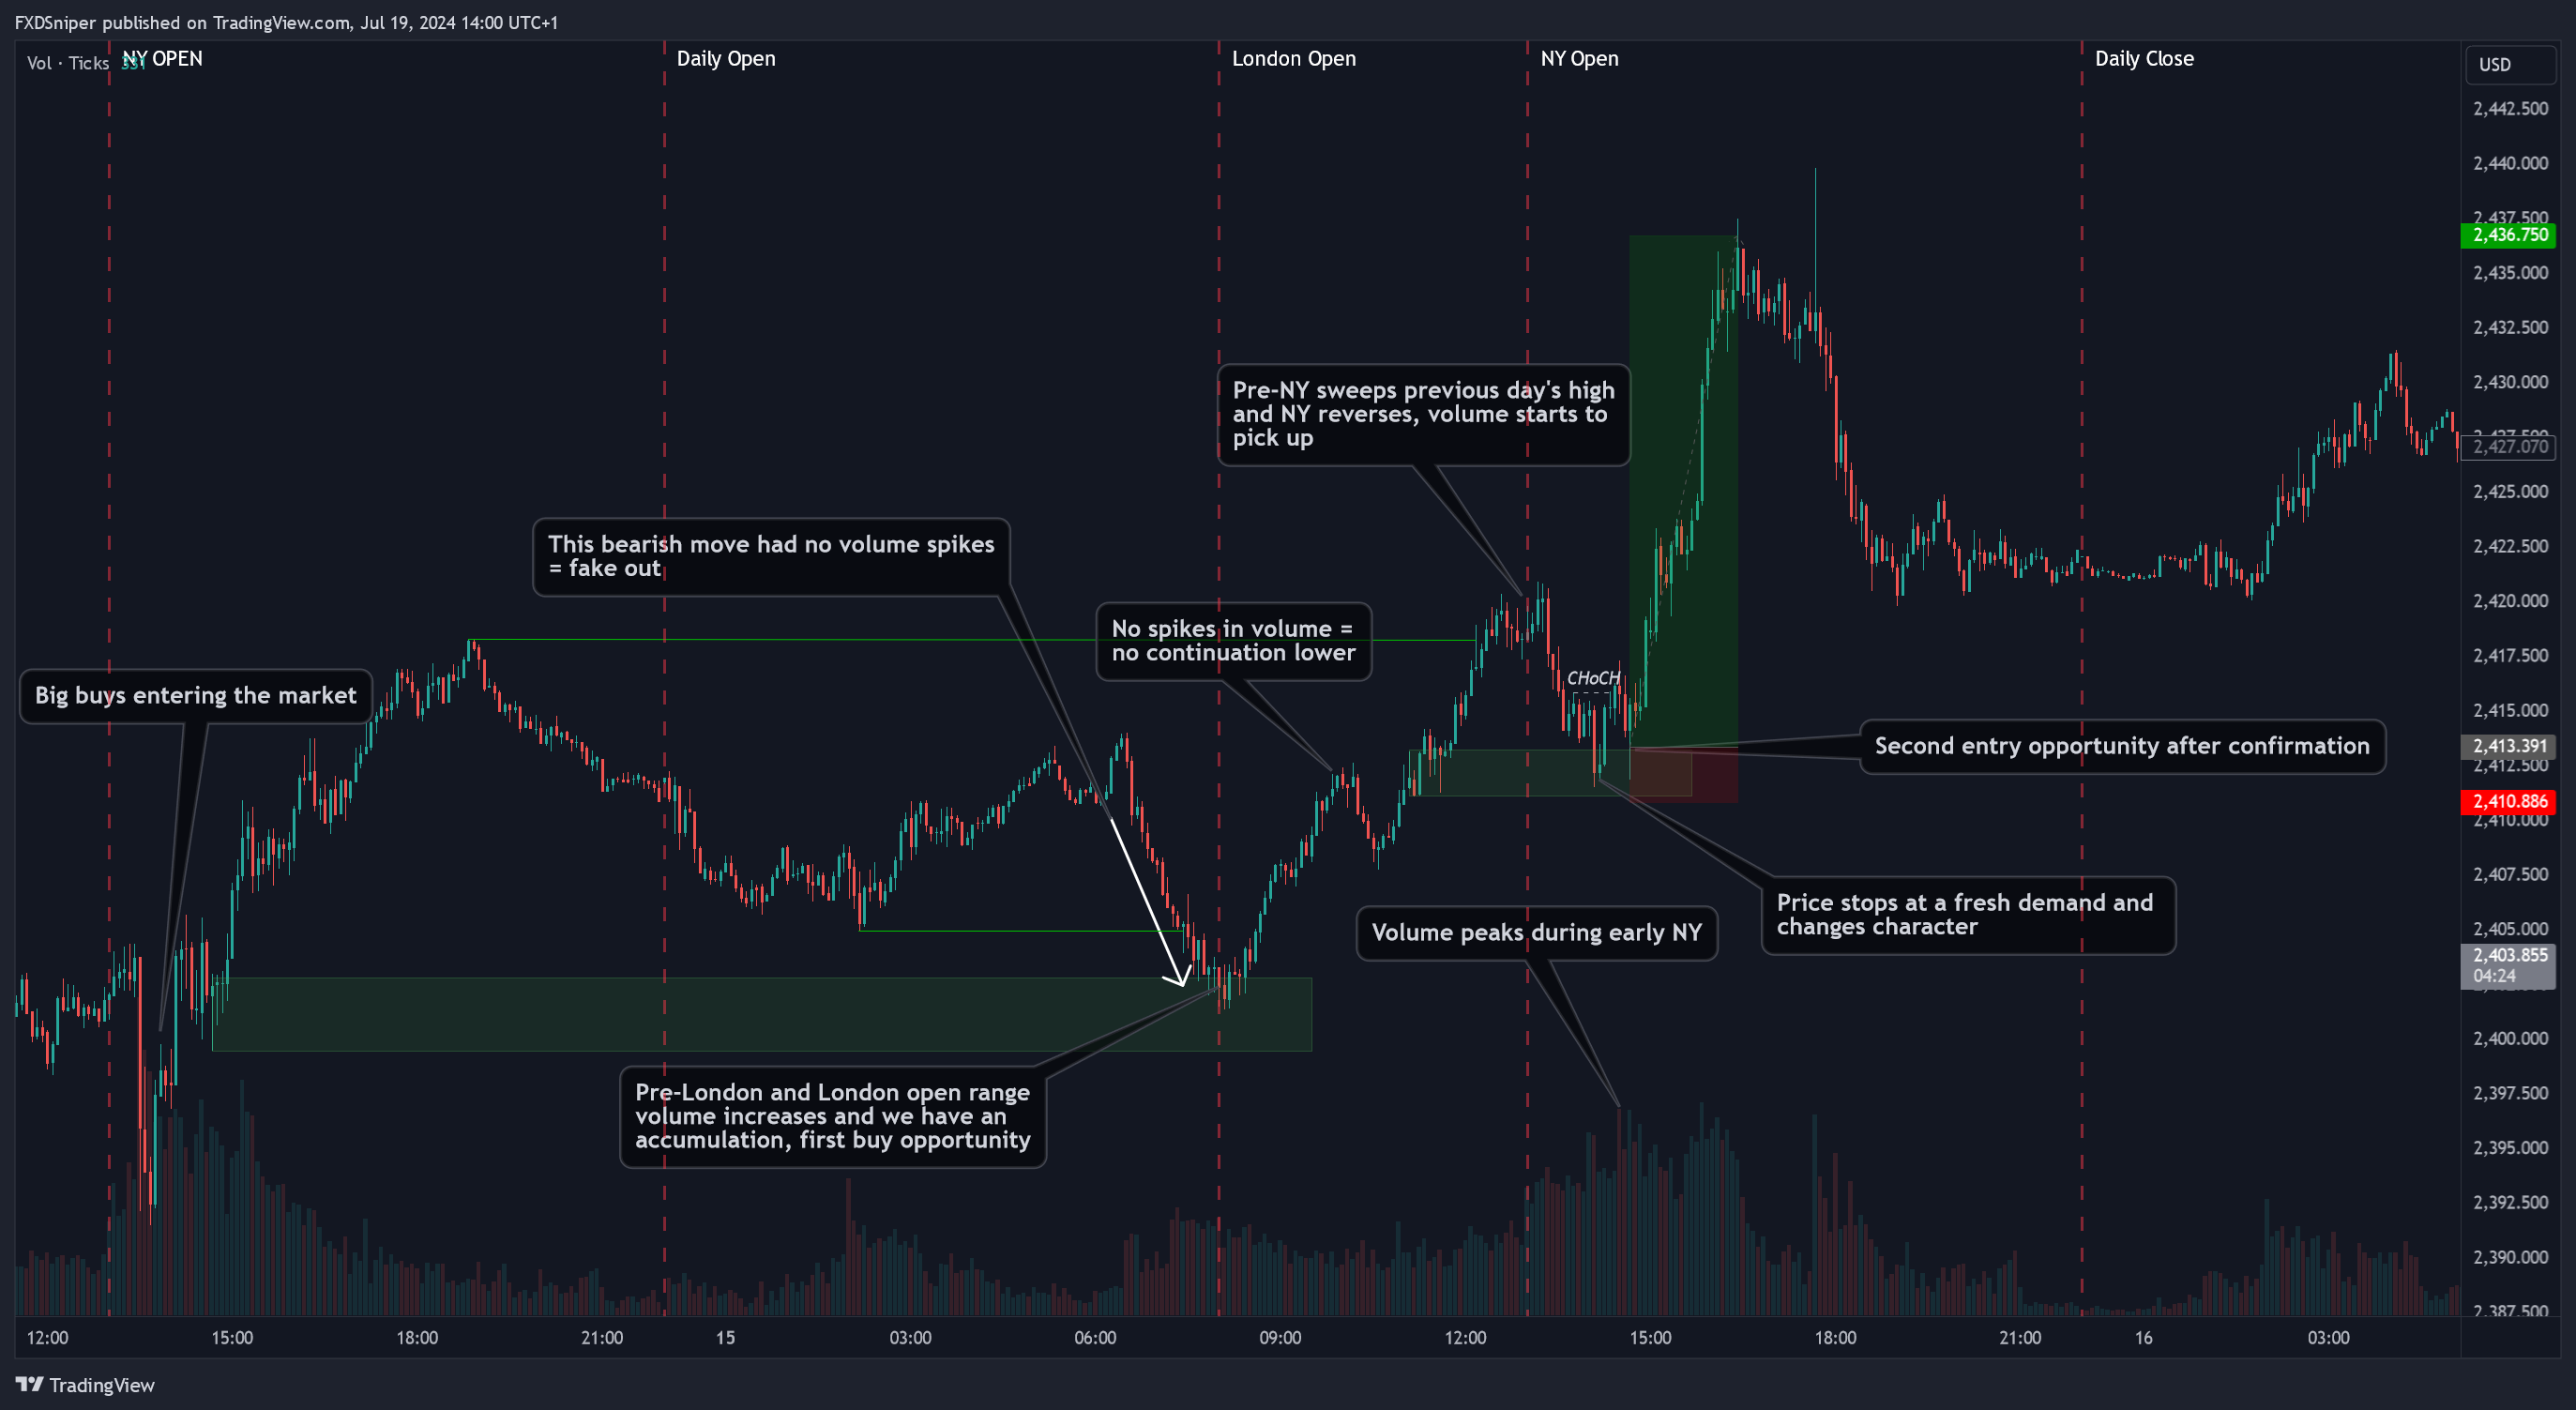
Just like in this example. Price was trending down, then all of a sudden it just melted almost 250 pips without any major spikes in volume. This signals a fake out. Notice once the low was created, the volume almost doubled and we had an accumulation within a small range. That’s where the real money came into the market and we had a huge reversal.
Understanding The Candles
Of course, as mentioned many times before, the shape and size of the candles do not matter. The markets don’t care if your candle is a doji, shooting star, or some engulfing superman 3000.
However, the candles are your data points. They show you how the price behaved within a certain time window, and that’s what matters.
Every single candle has a story to tell. You don’t have to focus on each one of them. Treat them like the words you’re reading now. Each candle is a different word. One may not mean anything special, but a few of them start to make more sense. Look at the full chart, and you have a story telling you what has happened and what is going to happen.
This doesn’t mean you’ll get a 100% win rate just by understanding the candles and their story. There are other factors that also come into play, such as your emotions, your current state of mind, whether you have taken a loss just now, etc. Even though you may speak perfect English, sometimes your brain will struggle to understand a basic sentence. The same thing applies to trading. You may miss a candle or misunderstand something. That’s why you need to manage your risk in case you are wrong and your capital needs protection.
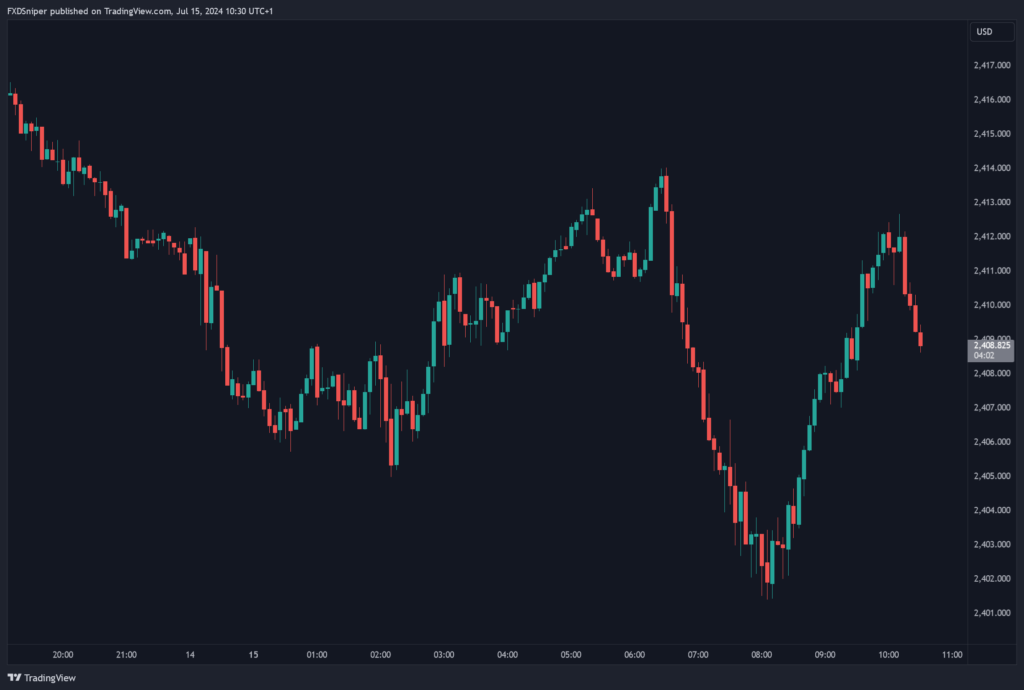
If you look at any chart with candles, no matter what timeframe, you’ll always notice the same things:
- Price doesn’t just move one way.
- There are sweeps everywhere.
- Each candle has wicks both ways.
Every time a new candle opens, you can expect it to retrace at least a little bit into the previous candle (create a wick) and then continue in its direction, this is just a natural price movement. When it comes to wicks, they are the most important part of most candles.
Why? Candles have two main components, the body and the wick.
The body is where most of the volume within that candle comes from.
The wick is where the most volatility took place within that candle.
Bigger wicks indicate that a significant spike in volume took place, potentially due to liquidations or a major order being triggered.
Small wicks and candles falling into consolidation indicate a potential market exhaustion. If there is volume supporting this, it may indicate a potential accumulation of orders and a subsequent reversal.
Using the same chart from above let me show you an example of reading candles and using the same methods taught in our courses.
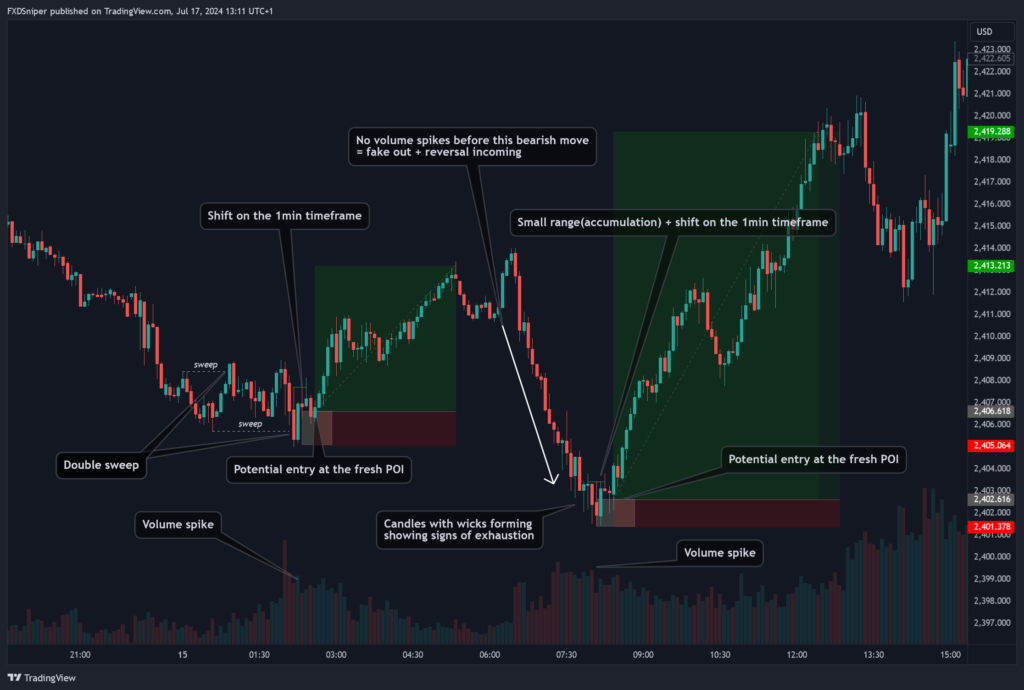
The chart above is a 5 minute timeframe on Gold. All that was needed for this analysis was candles and volume for extra confirmation.
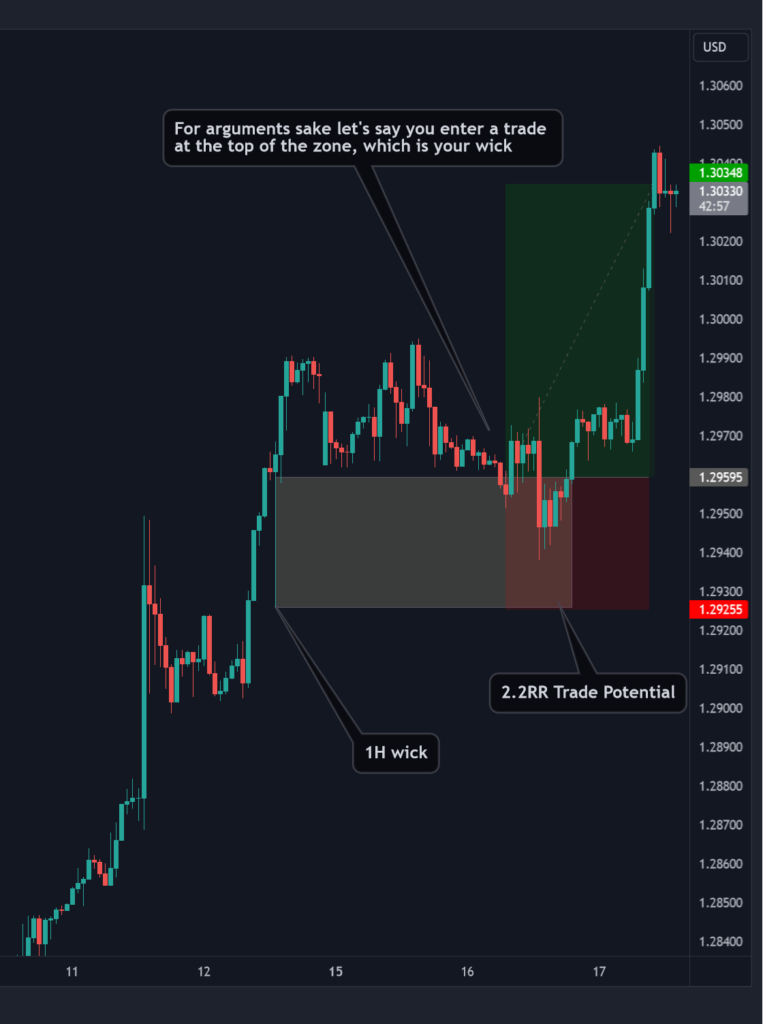
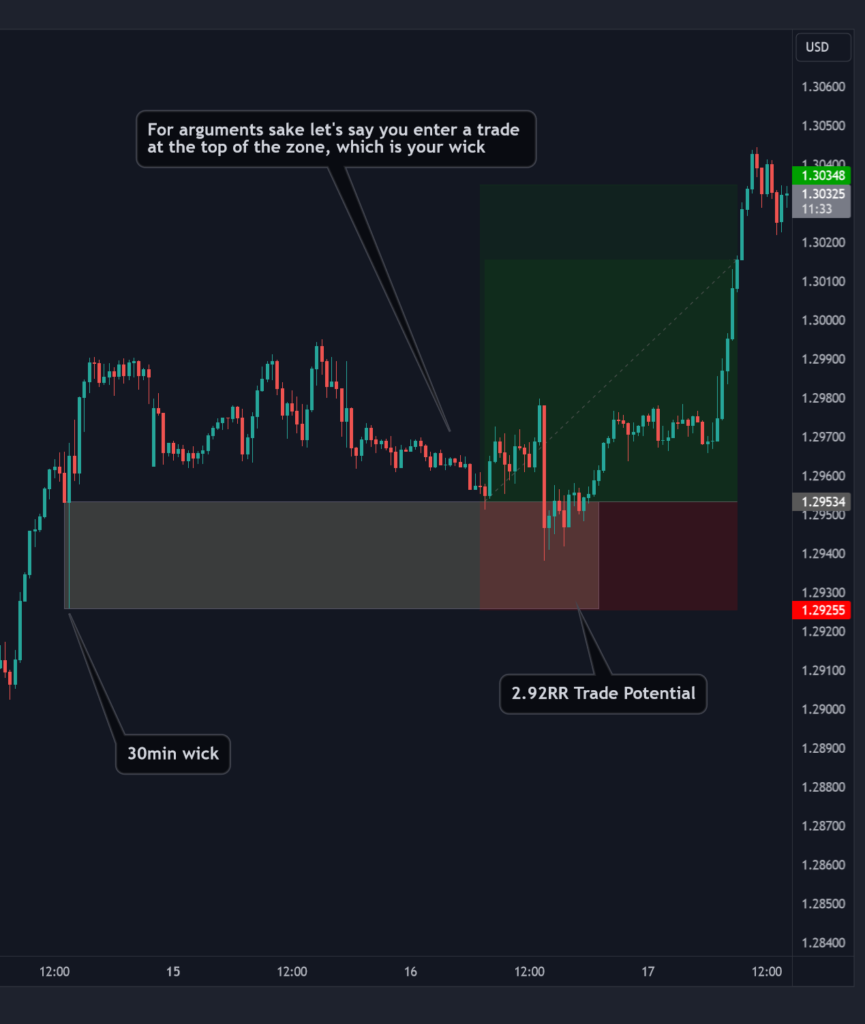
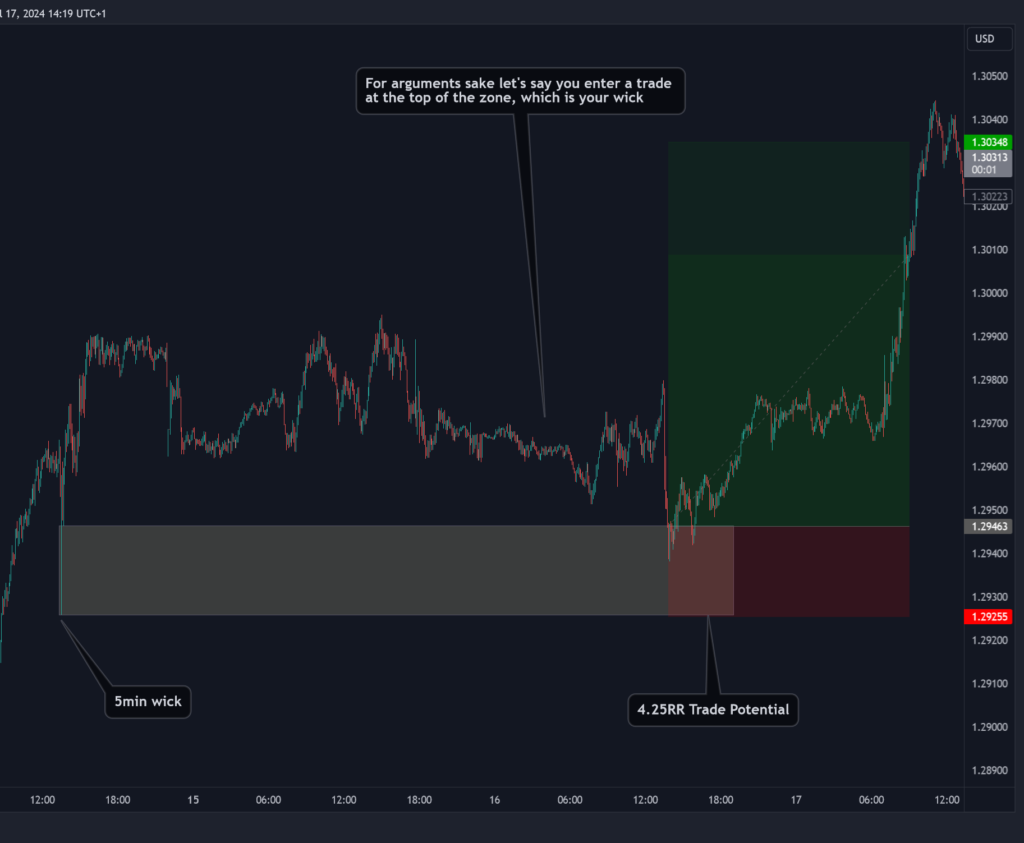
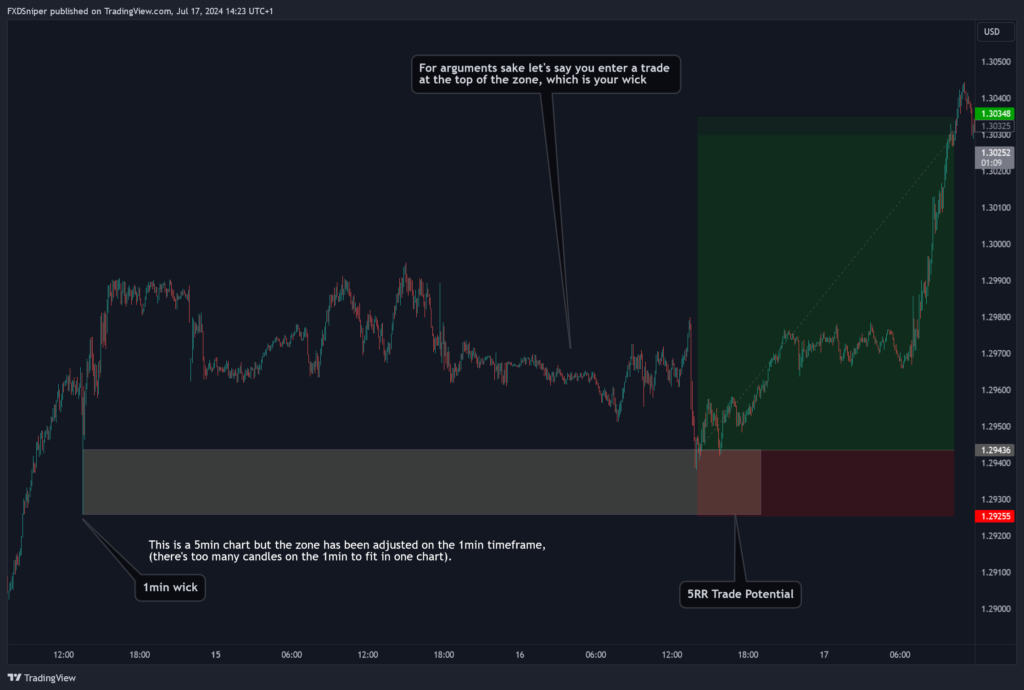
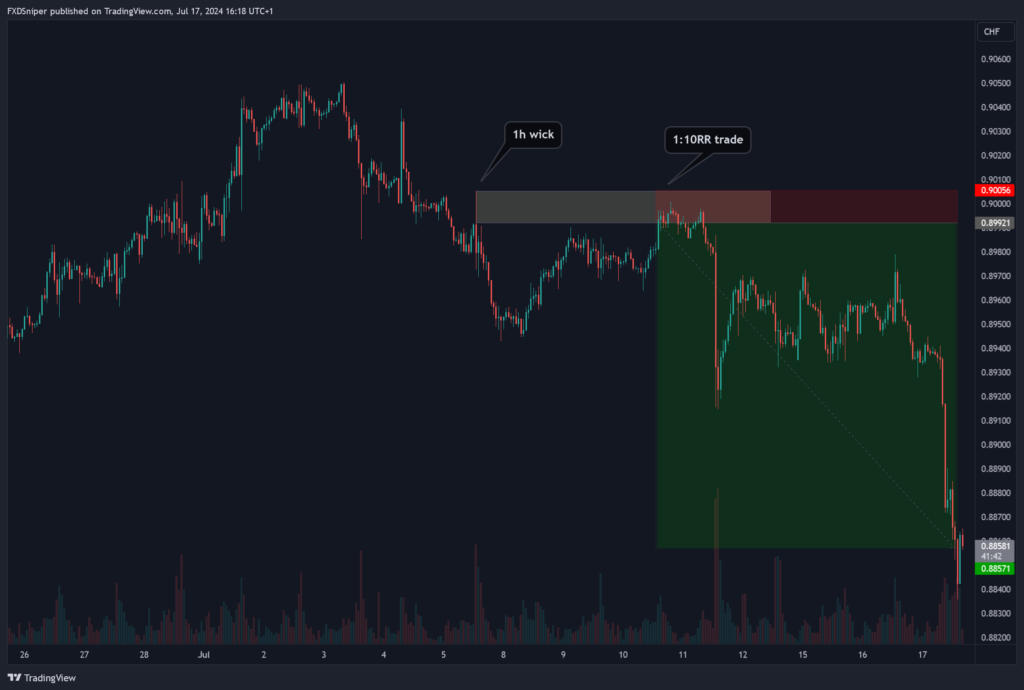
When it comes to wicks, keep in mind that a wick on a higher timeframe will most likely not be a wick on a smaller timeframe, that means there are hidden candles within that wick you can use for your analysis.
Let me show you an example:
The zone in this example has been adjusted from 1h down to 1 minute timeframe. More than doubling our risk to reward.
Of course, there are other ways of analysis you could use to improve this entry and achieve an even greater risk to reward ratio. But for argument’s sake, I only wanted to show you the wick adjustment.
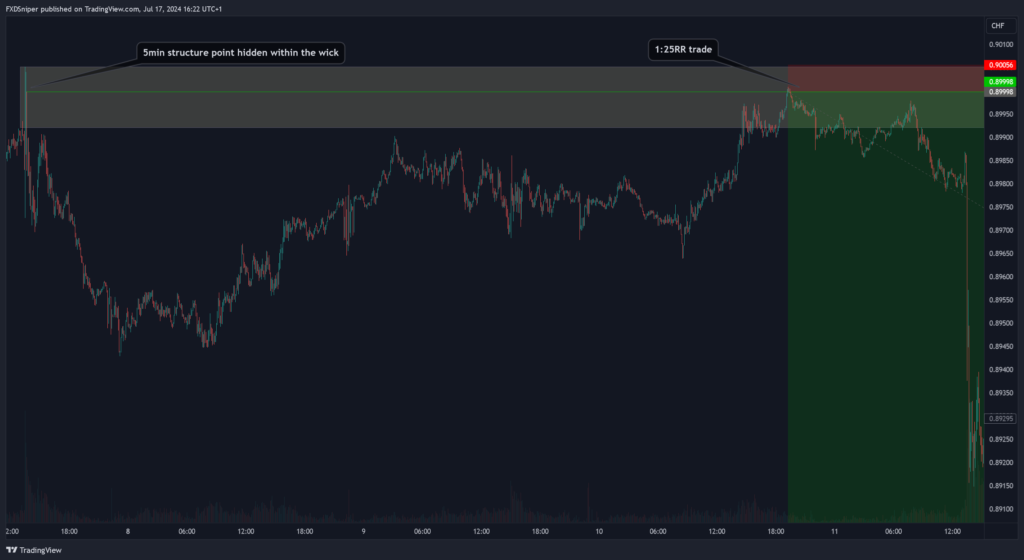
Let’s look at another example:
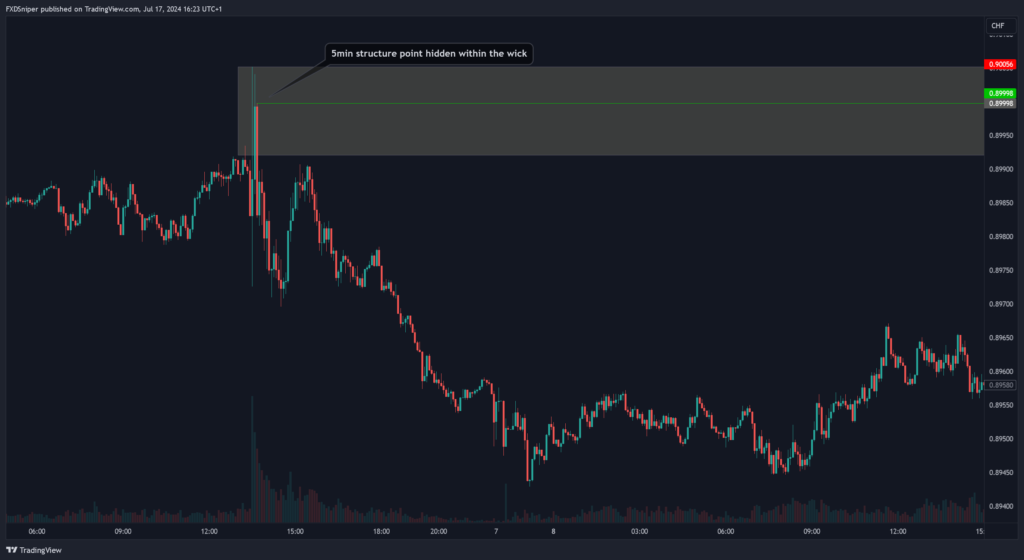
In this example we turned our 1:10 trade into a 1:25 trade because we used a hidden structure point within our zone as the entry.
Of course you can’t just pick any wick and try to enter based on what’s within that wick. You have to check the higher timeframes, find your bias, find your supply and demand zones, analyse the structure and then if you see the price approaching your zone go down into the smaller timeframes to pick the ideal entry.
I do want you to keep in mind what I taught in the course, wicks created by news will (almost) always be taken out. I just wanted to share the above examples to show you that wicks can be used to find hidden zones within the candles.
The rule of thumb is, the bigger the pair(Gold, EU, GU, etc.), the more manipulation it will experience. Smaller pairs tend to respect candles and structure a lot more even if it was created by news.
Candle Closures
They don’t matter. But at the same time, they do, just not the way you think.
Candle closures are traps. Almost every single strategy that involves candles, will tell you to wait for candle closures before entering the trade. The price doesn’t care if a candle closes bullish or bearish with a weird name. Price only cares about price.
Pretty much all algorithms that trade the market are designed to use the chart and the order book. That’s why most of them are programmed to use candle closures to enter trades, it’s supposed to give them confirmation of a trend. Those in control know this and they use this to trap market participants on the opposite side. You see a candle close bullish above resistance and you think it’s a sign to buy, just like 90% of other market participants. But the price drops, turns out it was just a sweep to grab liquidity. It happens all the time.
In most cases if you want to determine if a breakout is actually a breakout or just a sweep the candles and the volume will tell you before it happens.
Breakout + volume spike + accumulation = sweep
Breakout + volume spike prior = breakout
This isn’t a guaranteed formula to breakouts, but in the majority of cases that’s how it plays out. Also the volume spike before a breakout that confirms the breakout should happen much earlier than the breakout, if the volume starts rising minutes before, it still falls into the fake out category. In a real breakout you want to see the volume spike either at the bottom (for bullish breakouts) or at the top ( for bearish breakouts), that’s becomes those who are moving the price need to profit too so if they start buying or selling right at the breakout it just wouldn’t be that profitable for them.
So candle closuers don’t matter in itself, but if a candle pushes above or below previous structure with volume confirmations it indicates a continuation, regardless of what the candle looks like, it’s just price. So if the price liquidates the previous point in price with a volume confirmation it indicates that price wants to continue with the trend. If the price breaks the previous point in price and the volume comes in after, it indicates the money is only now starting to flow into the market and you’re likely to see a reversal.
Natural Behaviour of Candles
As mentioned earlier, don’t look at candles as candles. They are your data points. Understand the purpose of each candle and you’ll know what needs to happen and where the price is naturally heading.
Of course markets often act unnatural and they do irrational things. So things like supply/demand zones, inefficiencies may not be retested, at least not for a very long time so you just have to adapt and react to the data that you’re given.
Candles on the higher timeframe chart like the daily, will often give you a bias for intraday trades. There’s just a few concepts you have to look out for.
You don’t need to analyse every single candle, there are those that matter more than others.
If the price is stack within a range, it may not provide any useful information. If the candle breaks structure, sweeps liquidity or simply initiates a bigger move, it does have useful information for you to analyse.
These candles will often be retested or swept.
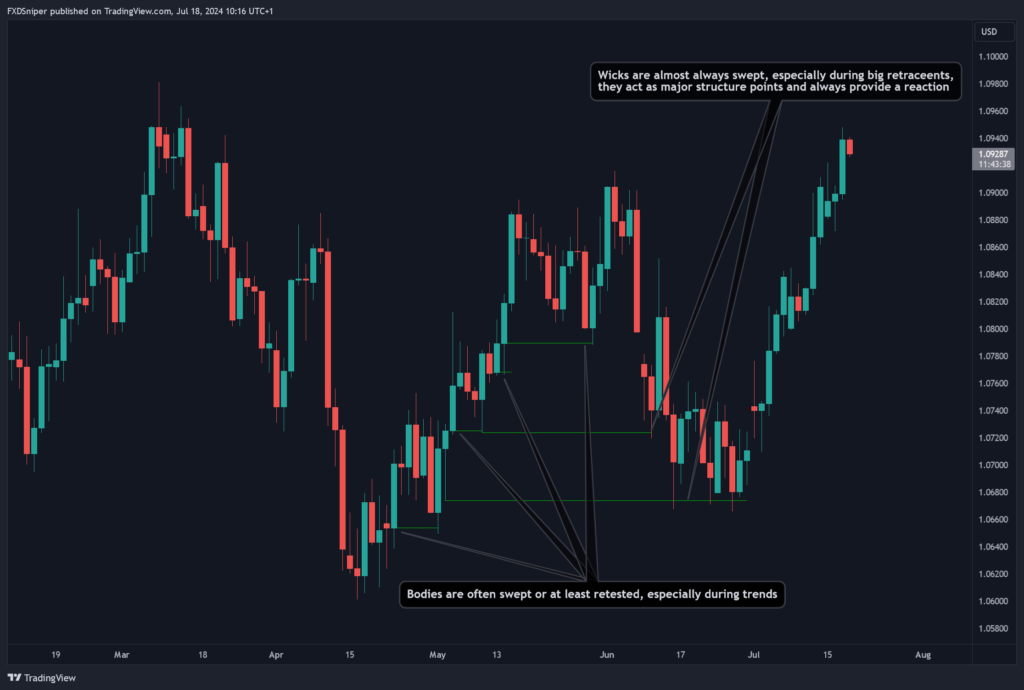
If you look at the above example, the candles I pointed to during the uptrend broke through previous structure or initiated the trend. Bodies of these candles were swept before the price continued higher. We know that body of the candles is where the most volume is located. Using our concept of “price is always looking to take out both sides of liquidity” it makes sense that these higher volume areas need to be swept before the price can move any higher or lower depending on the trend. This is a higher timeframe chart, on the smaller timeframe you’d probably find a structure point telling you exactly where and why this area needs to be swept.
If you know a body of a candle on the daily chart needs to be swept, you can use the smaller timeframe to pick the ideal entry around that area. Notice these sweeps aren’t big, this is a great opportunity for a tiny stop loss trades with massive returns.
In the above example you’ll also notice the retracement periods always sweeps the previous wicks that were of importance. These don’t always have to be wicks, it could be bodies too but in this example it’s wicks. They act as major structure points. We learned during the course that these major structure points almost always give us a reaction and they allow us to enter reversal trades with a high win probability. Just like with the bodies, these wicks are points in price where a big volatility originated, sweeping these points provides liquidity and momentum for reversals.
Same thing applies to all timeframe candle closures. When for example a 1 hour candle closes bullish, you can expect the open of the next candle reverse into the previous candle to create the wick and then continue, or the new candle open may continue and reverse later on creating a wick in the opposite direction.
And the same thing applies to all session opens or the daily open. This happens because for example, the day starts with the Asian open, this is the most recent liquidity that entered the market. Now when London opens and it wants to grab liquidity it would look to take out the some structure point from the Asian session. Just like New York would target the liquidity from the previous sessions to fuel its desired move.
All these things happen on all timeframes. If you trade using limit orders, it would be a good idea to place them on the open/close of a candle or the wick, anticipating a sweep.
Understanding The Volume
Us retail traders, we don’t have access to any sophisticated softwares worth millions or billions that the banks or institutions use. Our data is limited. The only thing we have is the chart, the candles and the volume. This shows you where the money went and where it is flowing right now.
Sure, you can use indicators or other tools to help you figure out what is happening but there is no indicator that shows you what is happening right now. They are all lagging behind the current price, so by the time the indicator gives you a signal, it’s already too late.
That’s why I do not use anything other than candles and the volume on my charts. Lot of the time I don’t even draw any zones or do any analysis in general. I only do it to show my charts to you or other people. The cleaner your charts are, the easier they are to read.
Using volume is the best way to tell where the money is going. Combining that with candles, structure, supply/demand and you start to have a pretty good idea of the story the chart is telling you.
Most charts will have volume spikes during London and NY session opens. But that doesn’t mean that there is any less volume during the Asian session. It’s just that most of the brokers out there use liquidity providers that are outside of Asia. If you found a broker that is based in Asia you’d notice that the volume there looks much different, and it’s close to the other sessions.
The main thing to look at when looking at volume is to check where the peaks are:
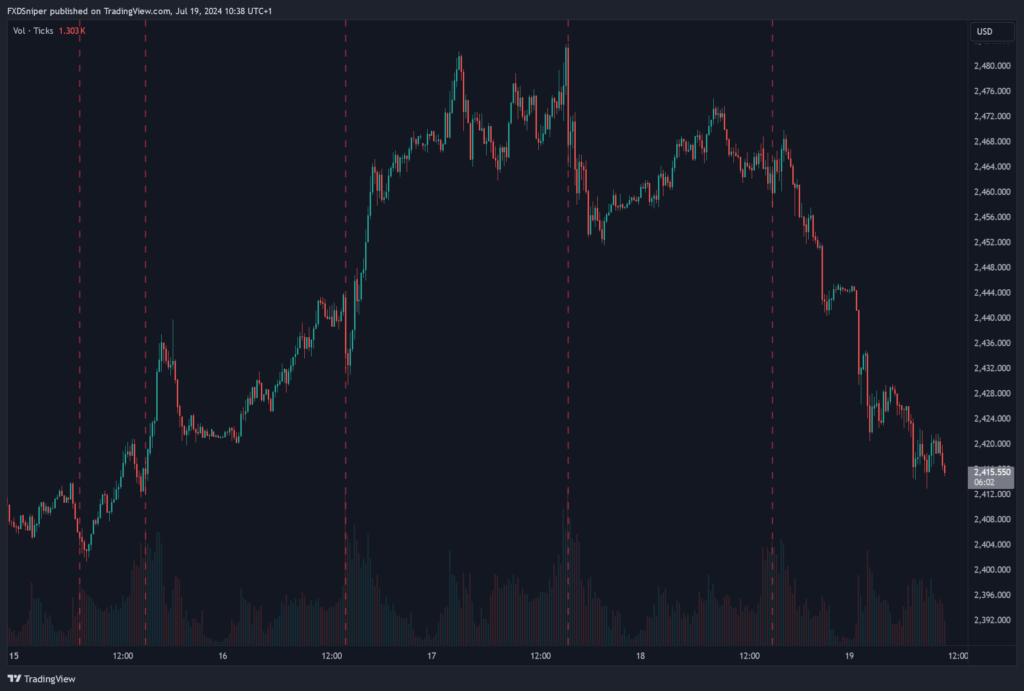
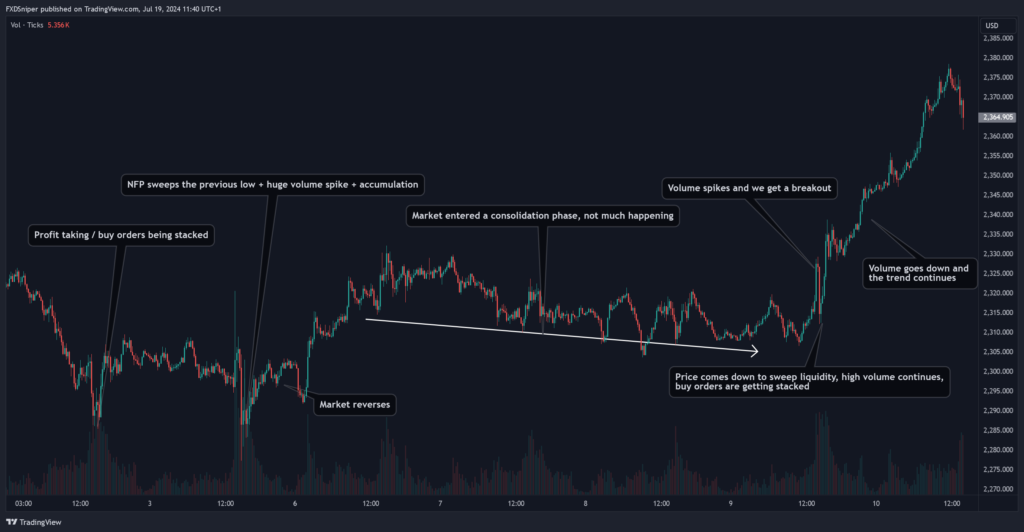
Each volume peak correlates with either a push or a reversal. This suggest there’s either money being added to fuel the continuation or there’s profit taking / order accumulation to reverse the price.
Often you’ll notice that during high impact news, the price will create an impulse opposite to the trend. That’s where the volume spikes, orders are being accumulated and the price reverses to continue with the trend. It’s a very common news patters that’s designed to liquidate other participants and gather liquidity to push the price. And as mentioned many times before, if there is a big momentum move happening without any prior spikes in volume it is likely that is a fake out and price will reverse.
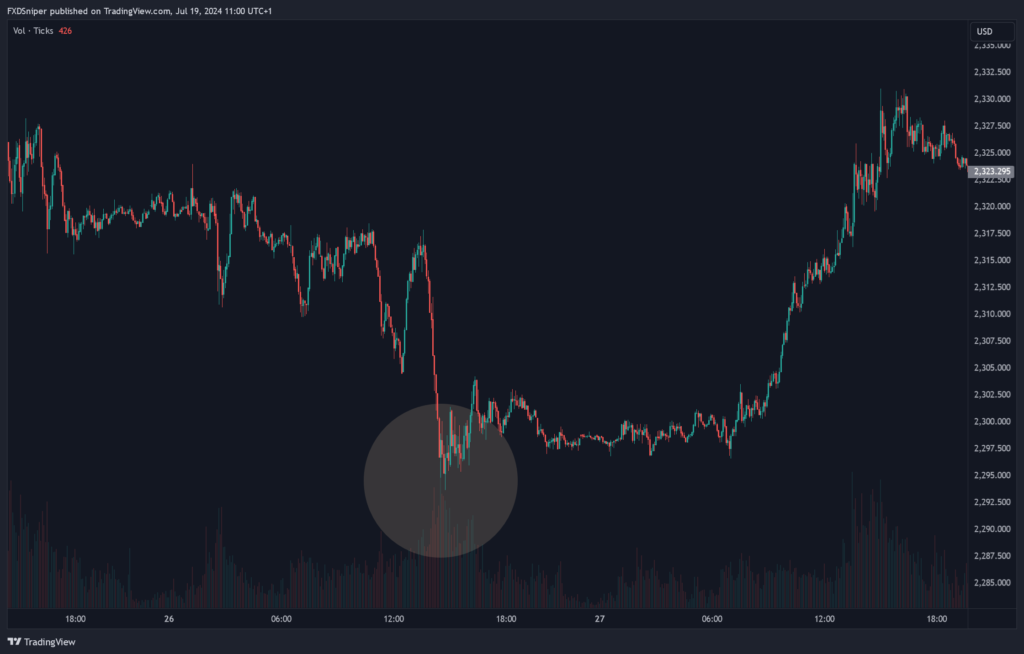
Just like in the example above. Notice how the biggest volume spike happened at the lowest point but there wasn’t any major volume spikes before the massive sell off. That’s the market pushing the price to trigger the required liquidity for it to stack orders and push the price in the opposite direction.
Of course you can’t use volume without understanding the chart first. Volume without candles doesn’t mean anything. You need to analyse the structure, find your supply and demand zones, areas of liquidity or whatever else you want to use in you general analysis. Only then you will get an idea of what the volume is telling you and where the money is flowing.
Here’s an example of volume analysis over a longer period of time:
And here’s an example of a fake out:
So to summarise the volume is a tool used to show you where and when the money is coming in and out of market and it’s a tool used to add confluence to your overall analysis. What the volume shows is highly dependent on what the price is currently doing and where it’s at.
Understanding The Structure
There’s no need for me to explain structure here as it’s a pretty straight forward concept. So in this part of the guide I’ll just show you a bunch of examples with explanations and how everything combines together.
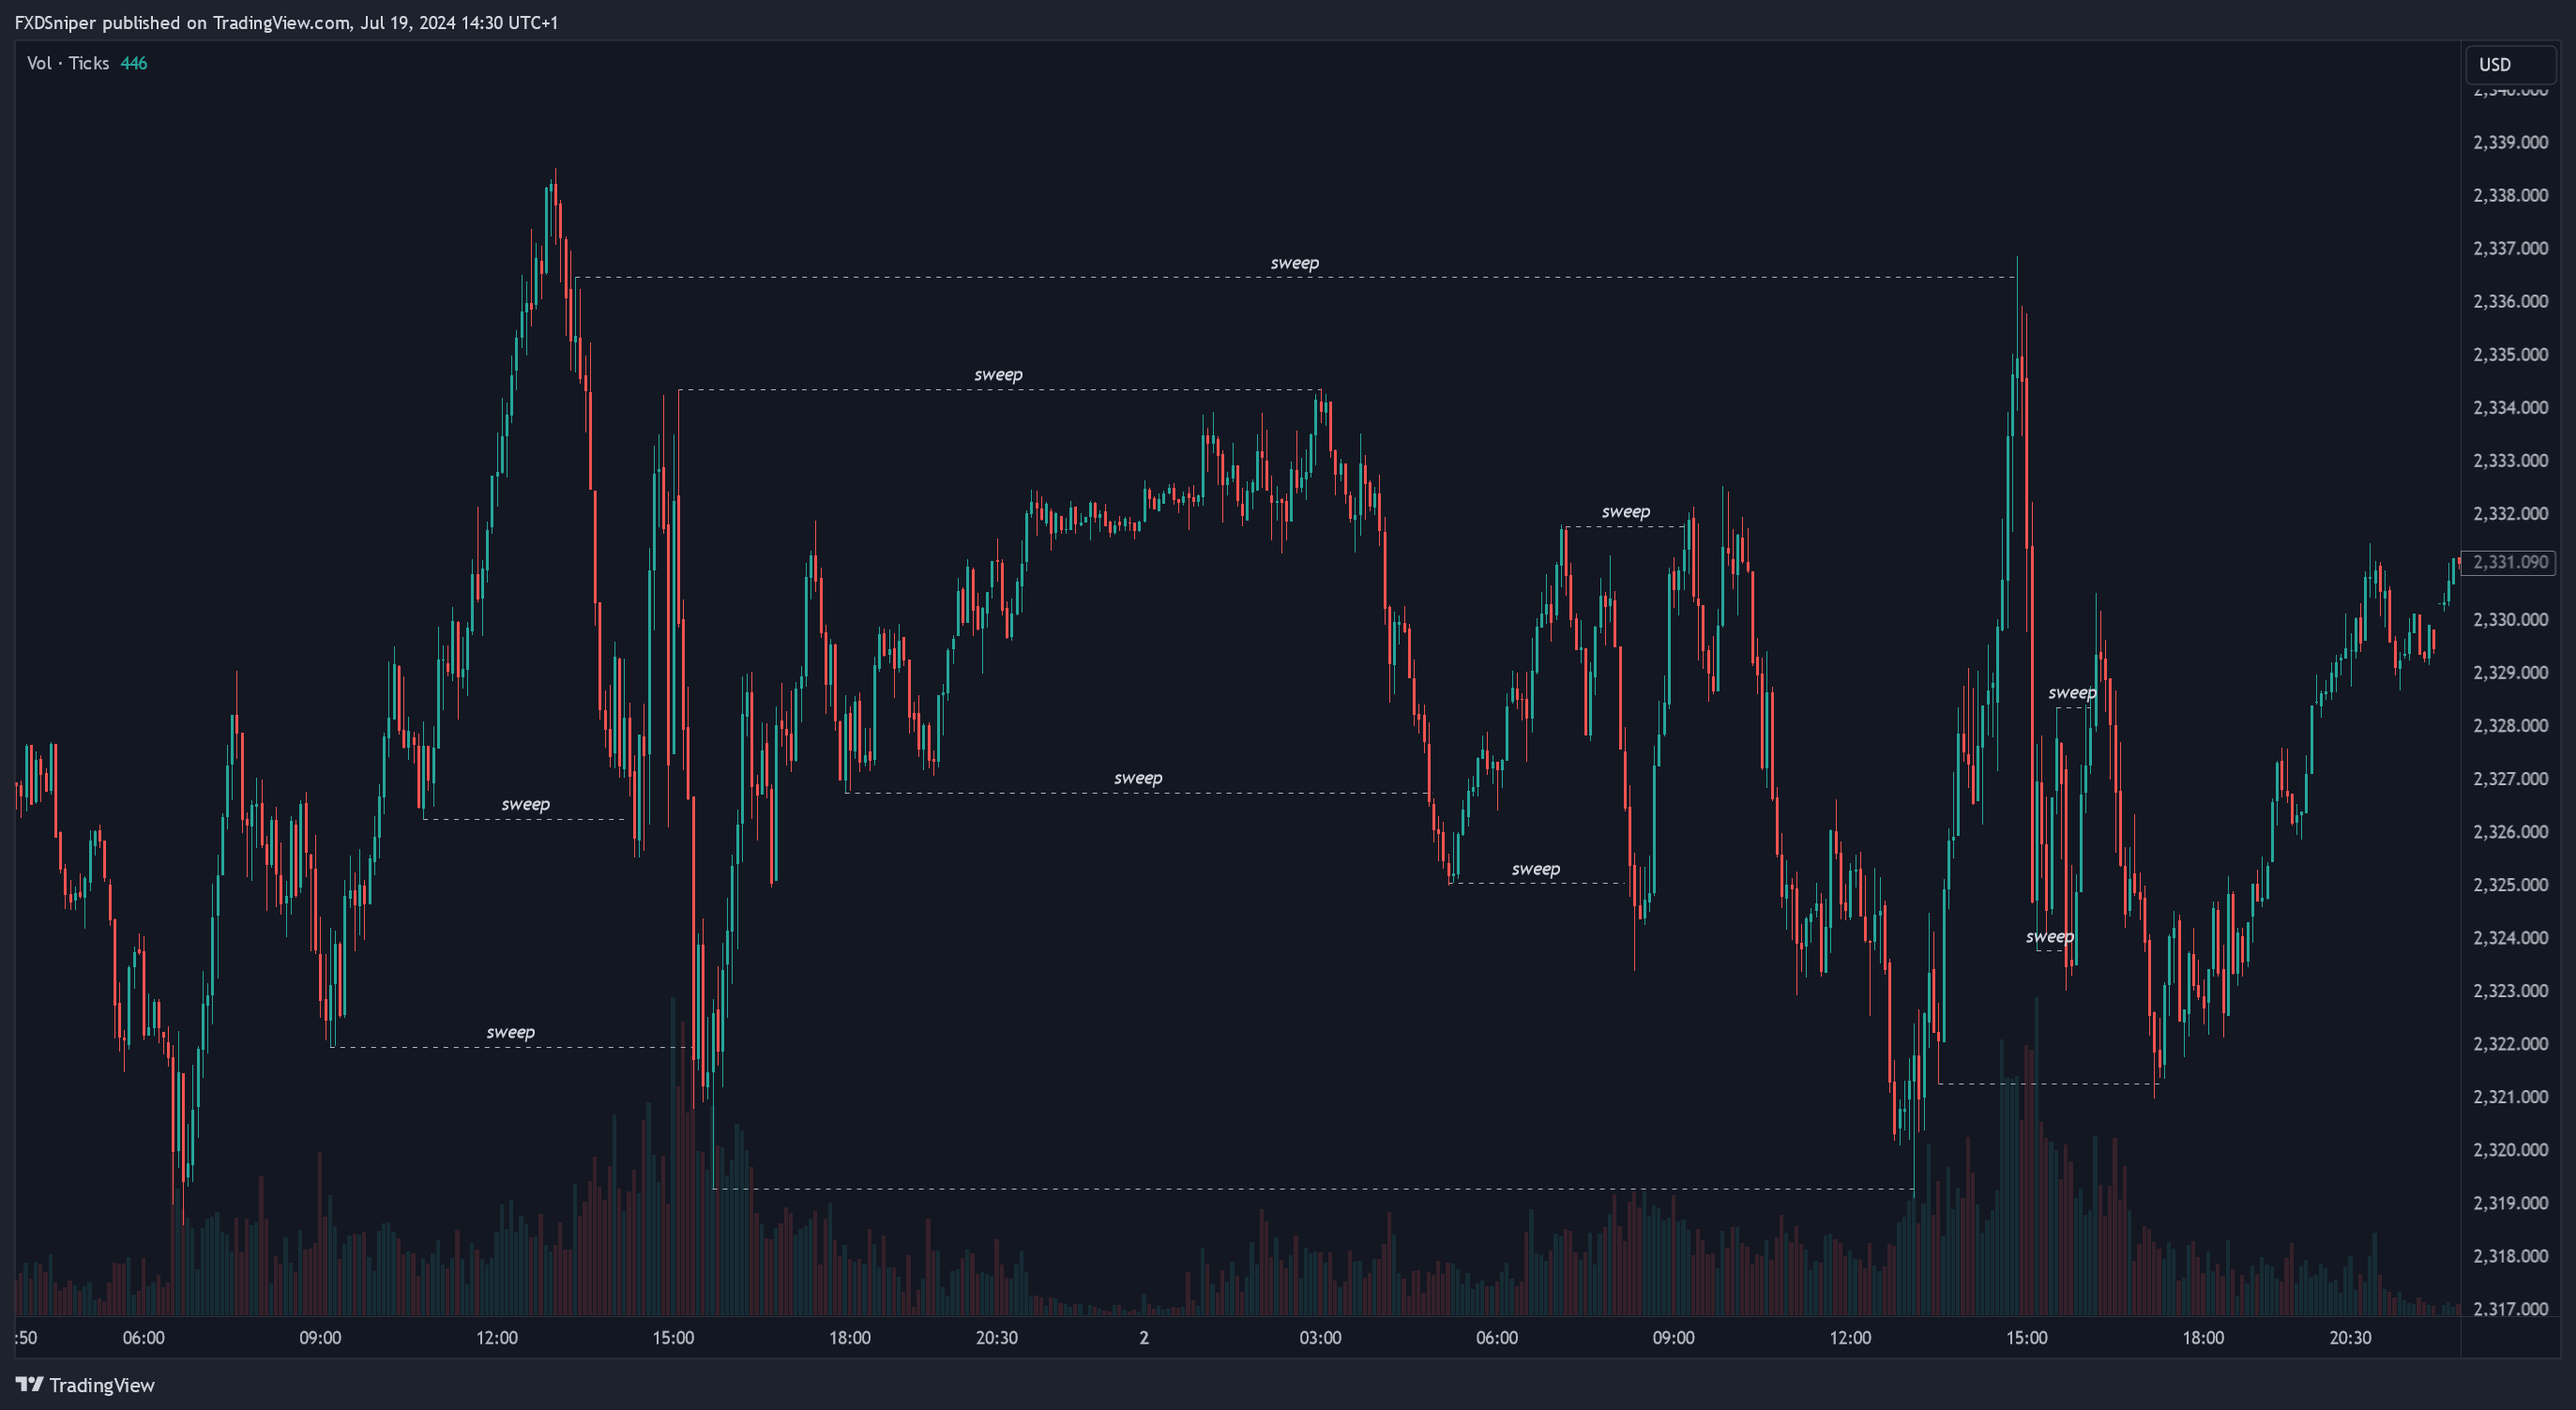
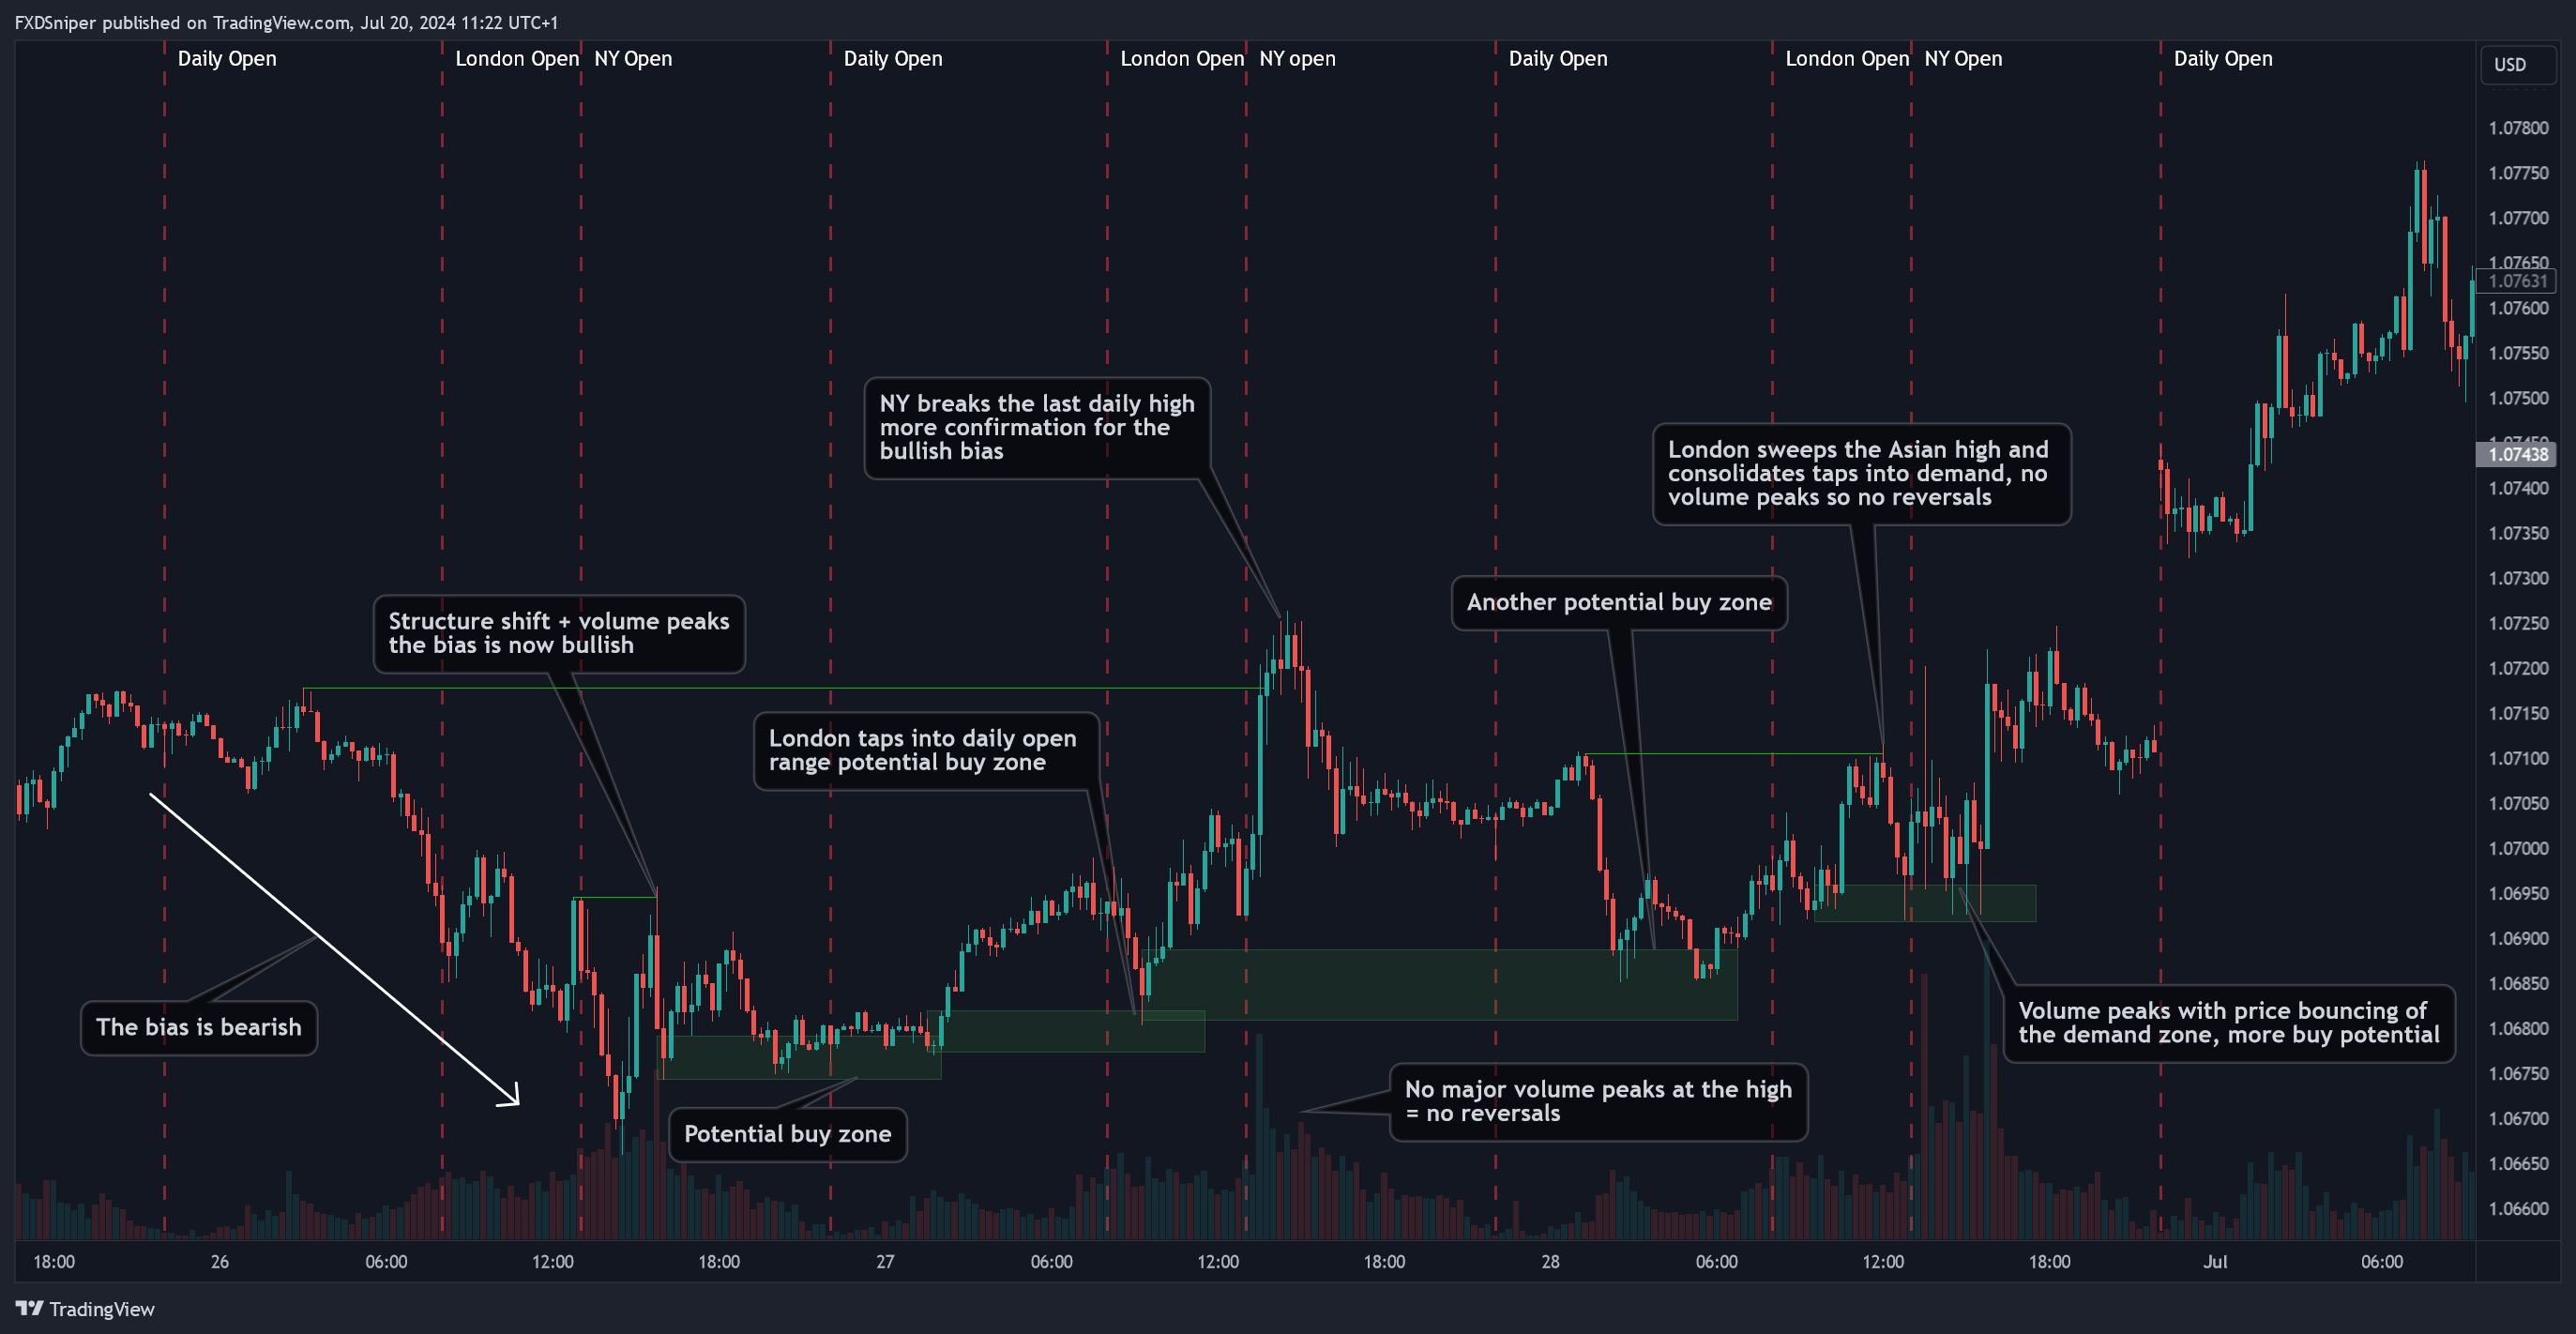
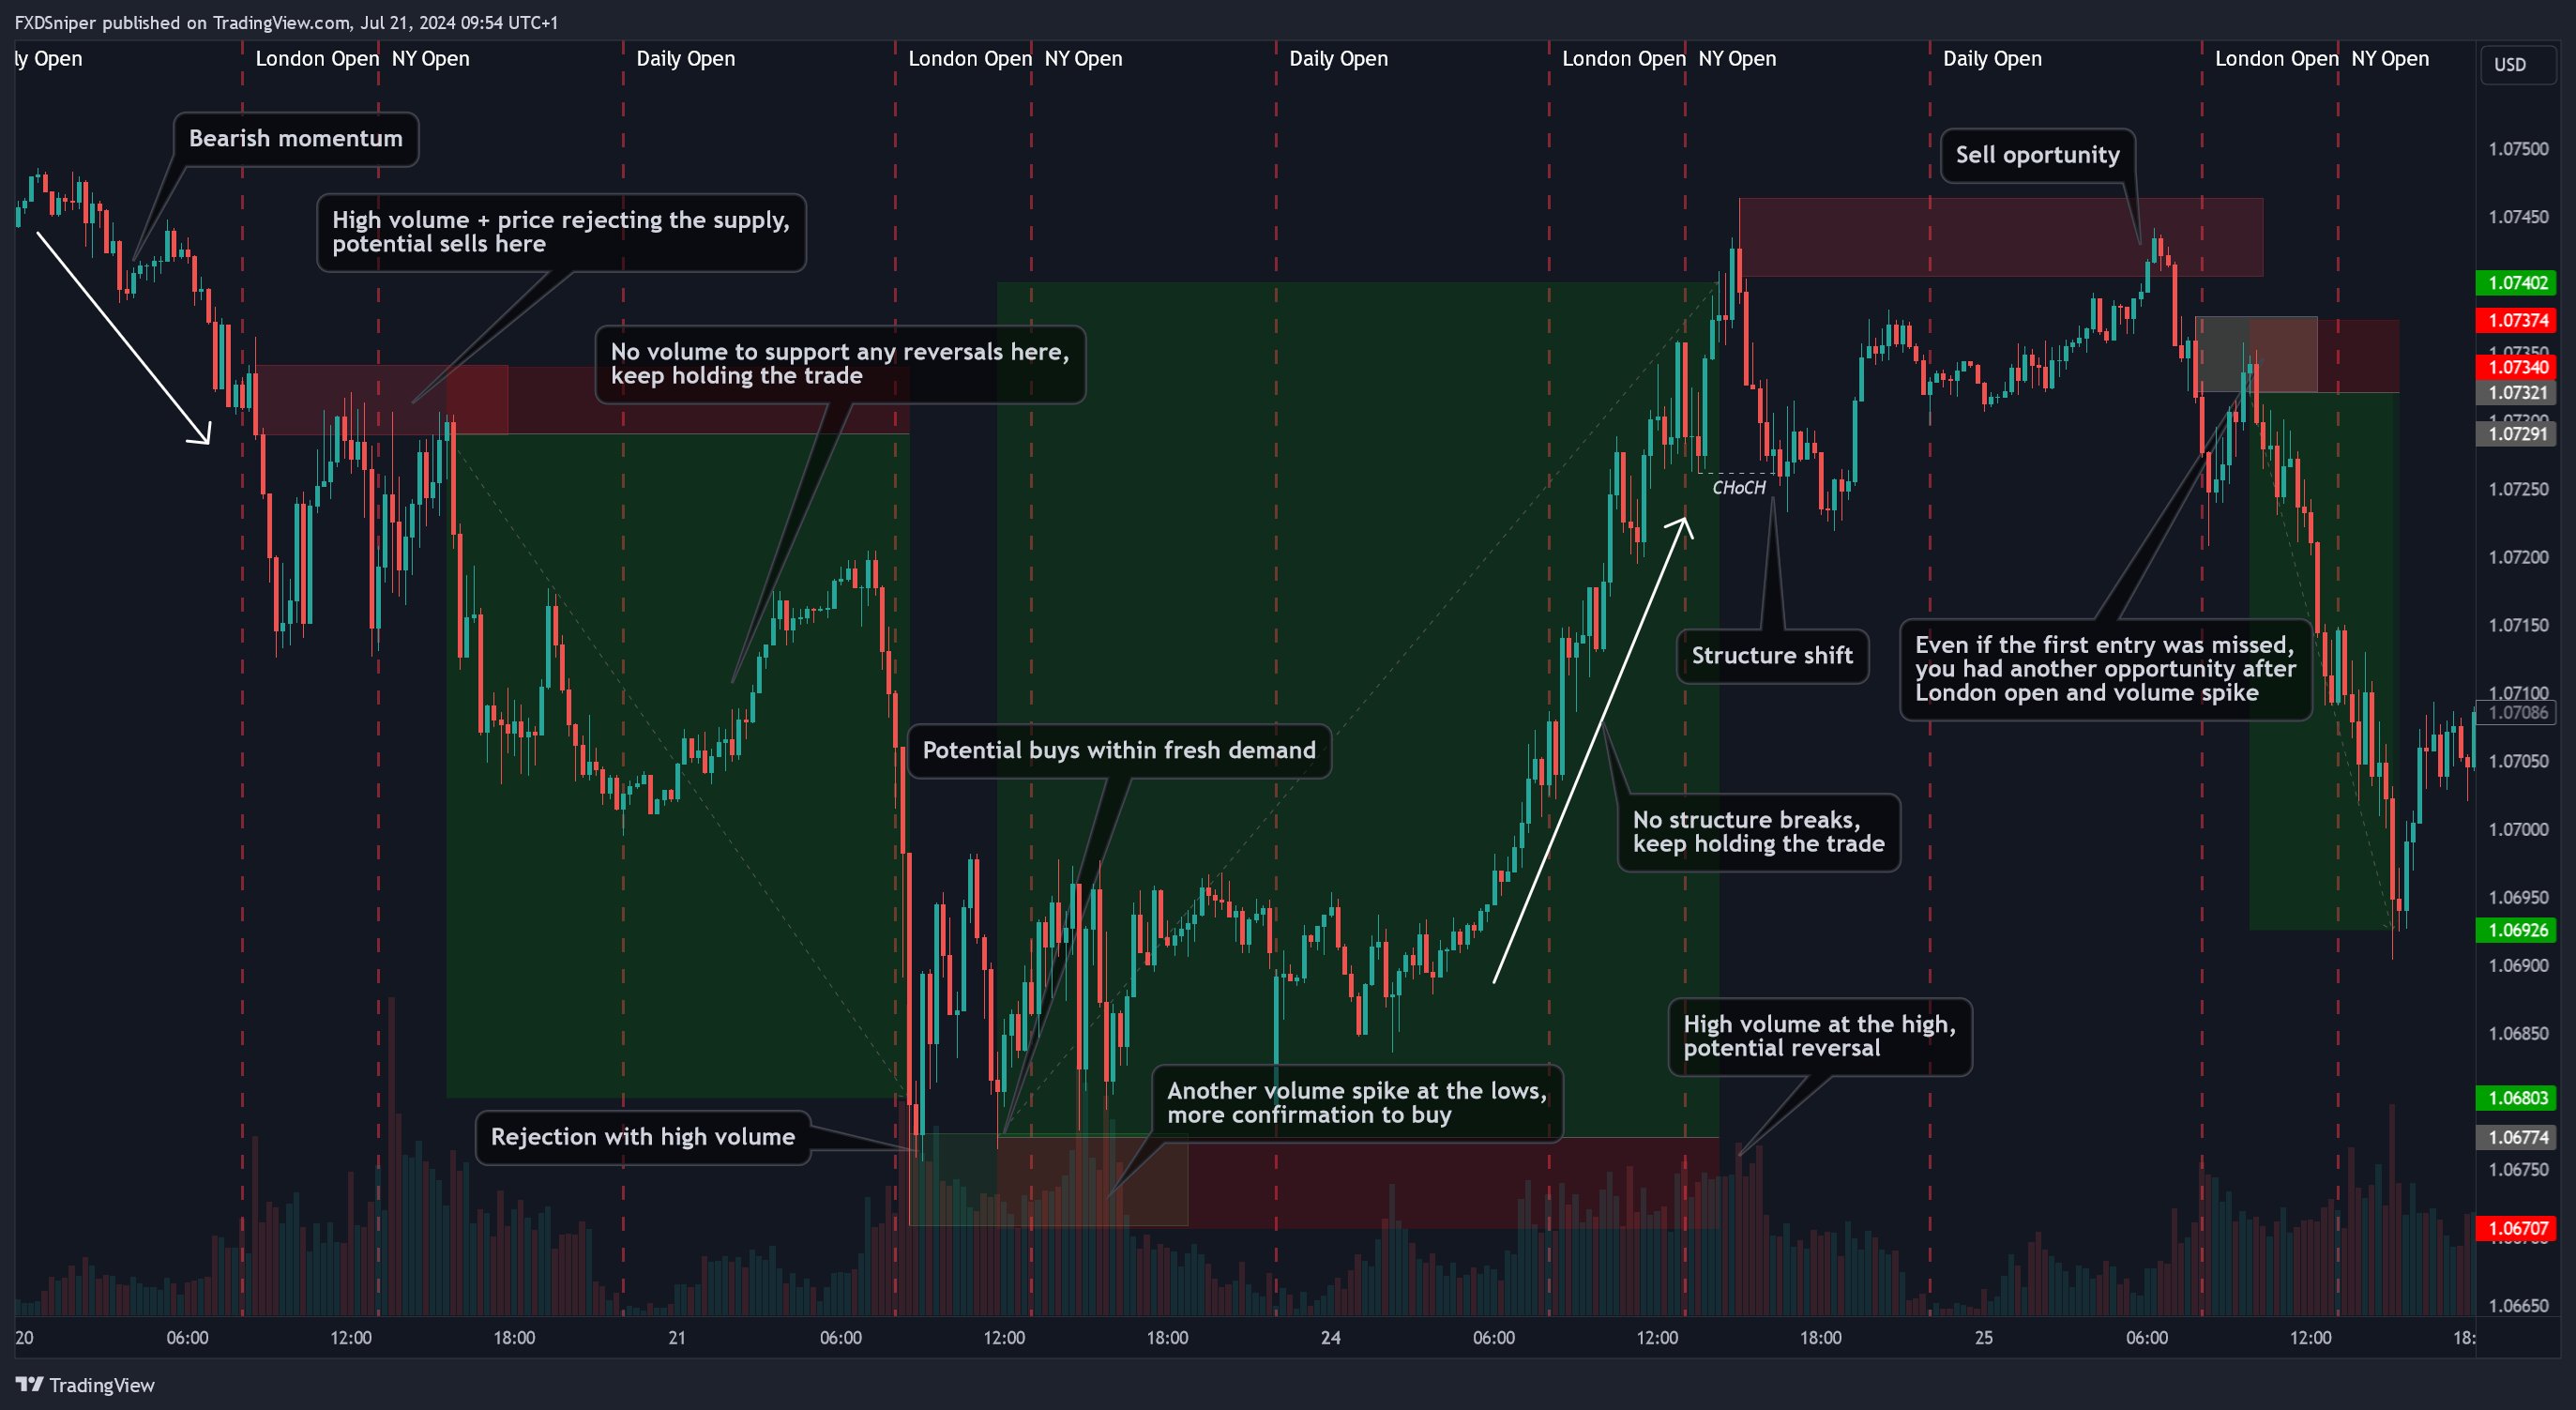
The above example is meant to show you why it’s pointless trying to predict every single move in the market. There are sweeps and breaks of structure all over the chart. If you tried to predict every move here you’d just fry your brain out.
The second slide shows you how you can minimise the noise and find high probability trades. Assuming most people trade the London and New York sessions, the trades and analysis is based on these sessions.
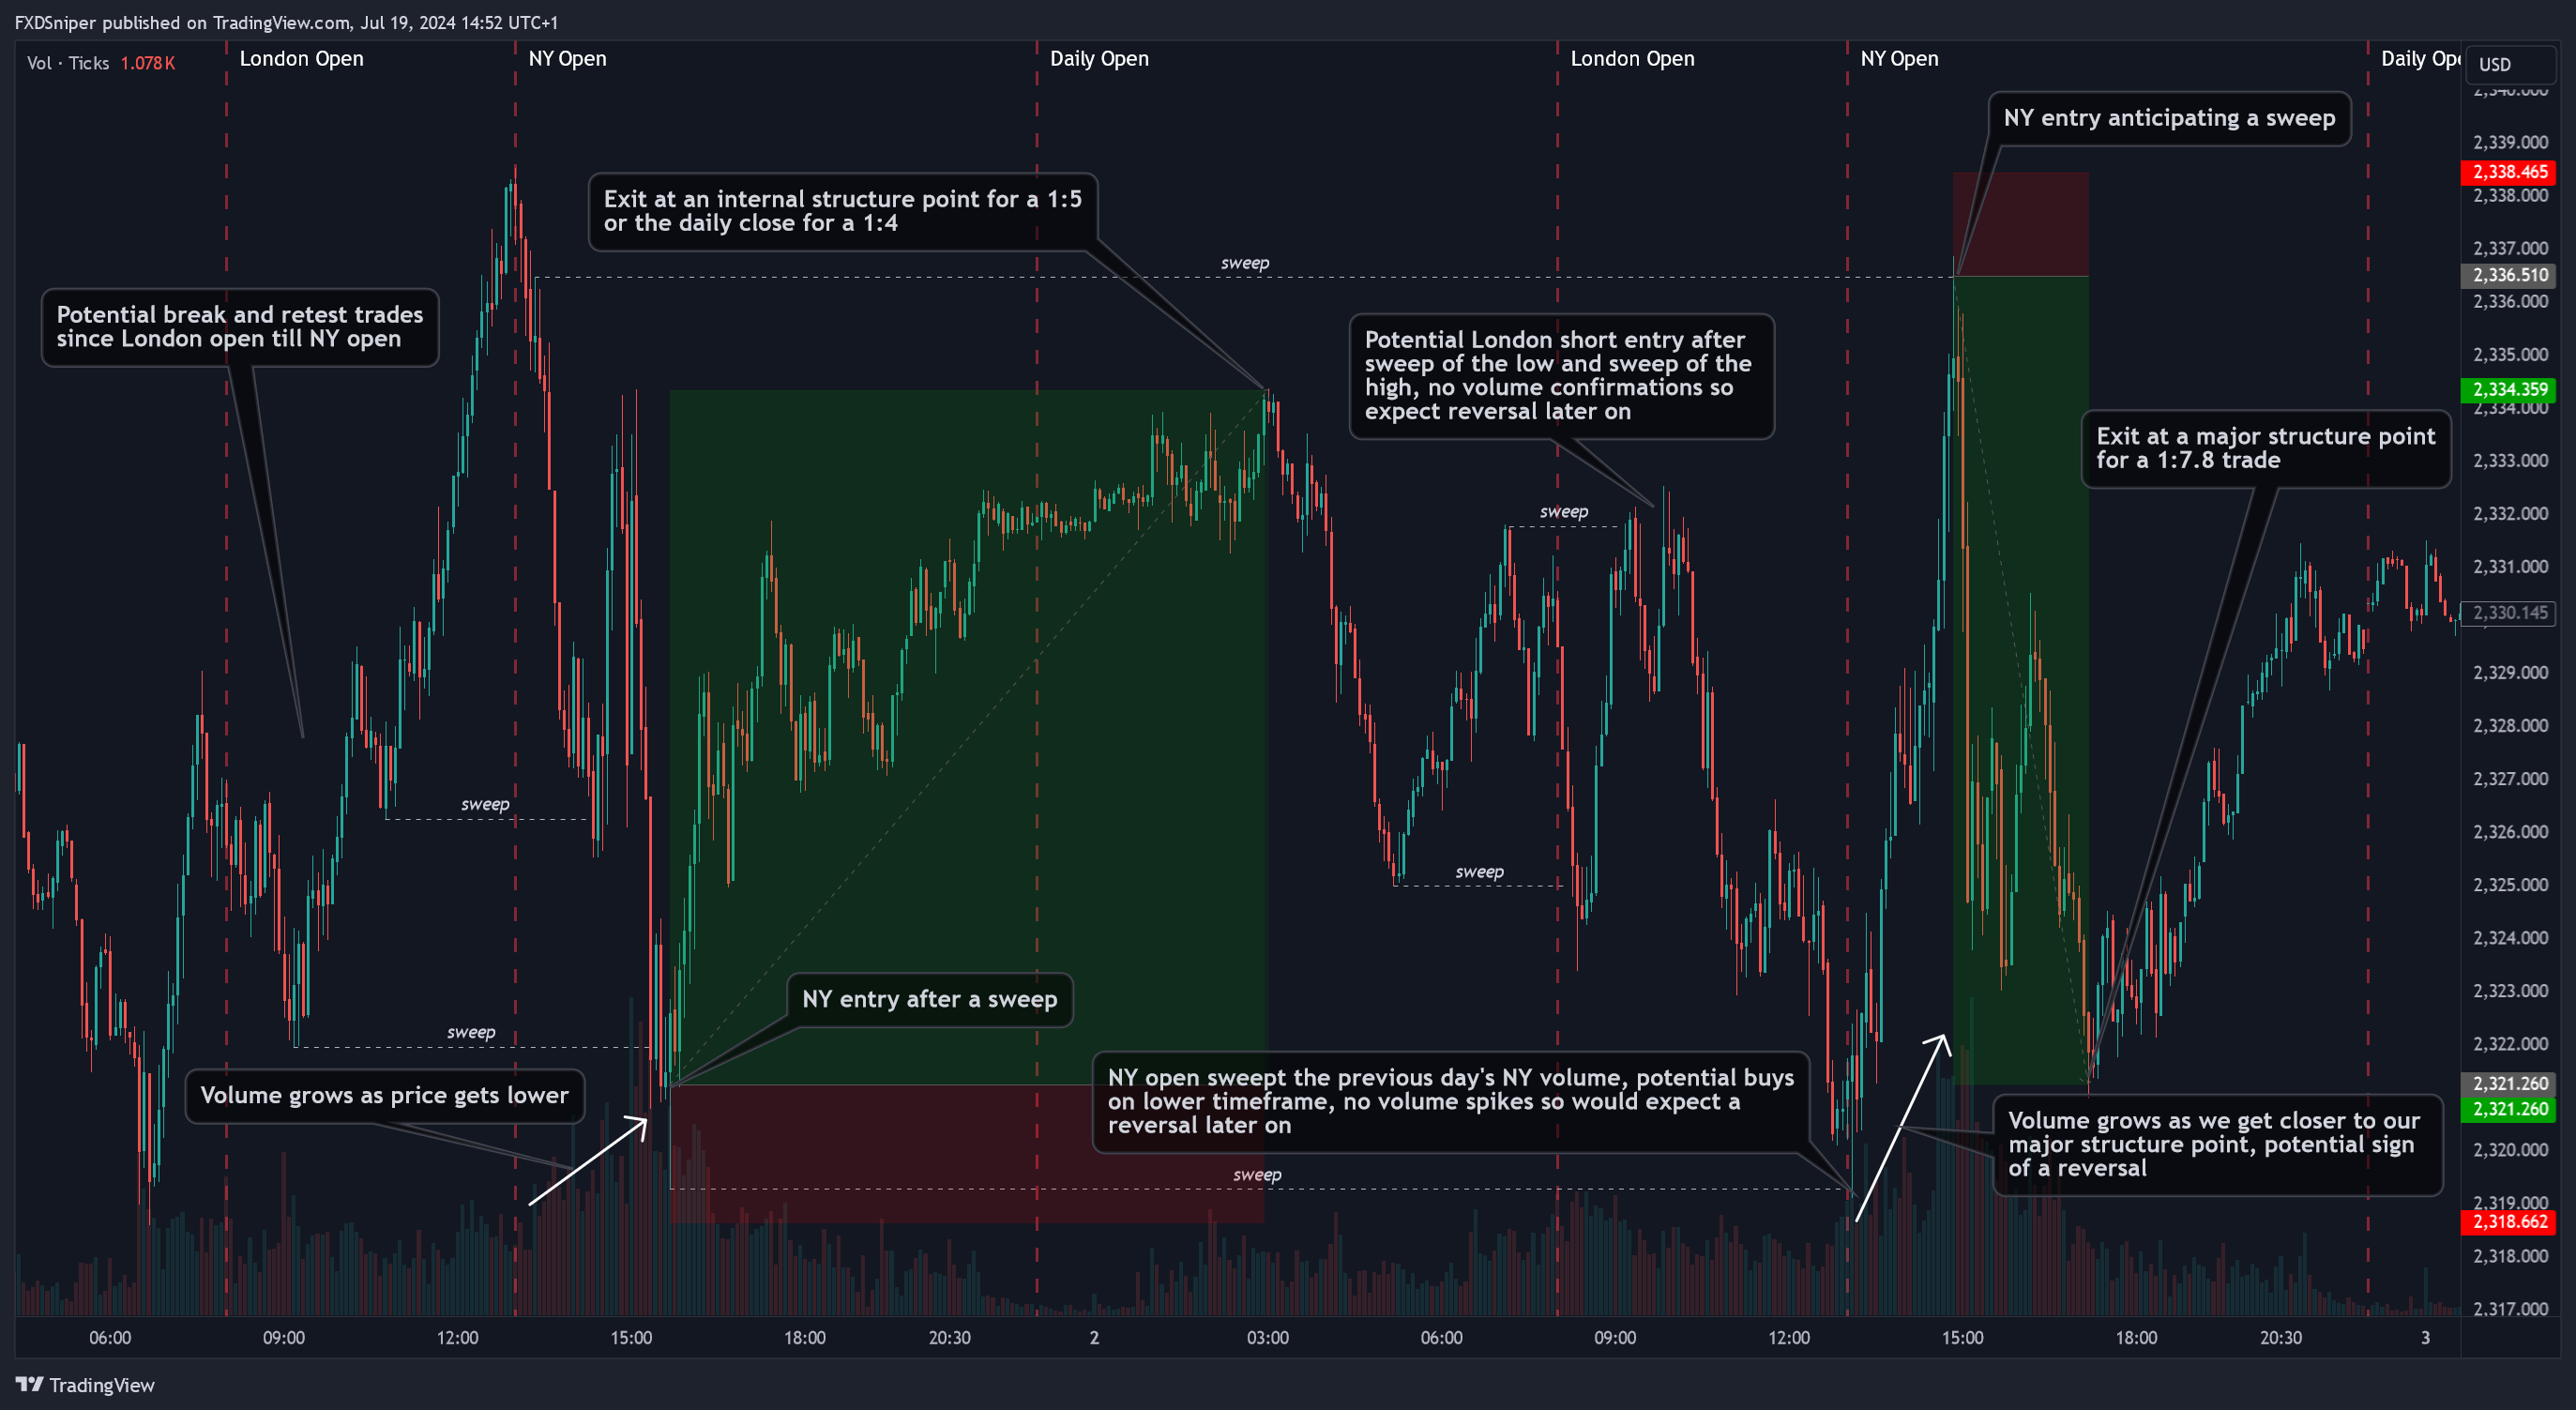
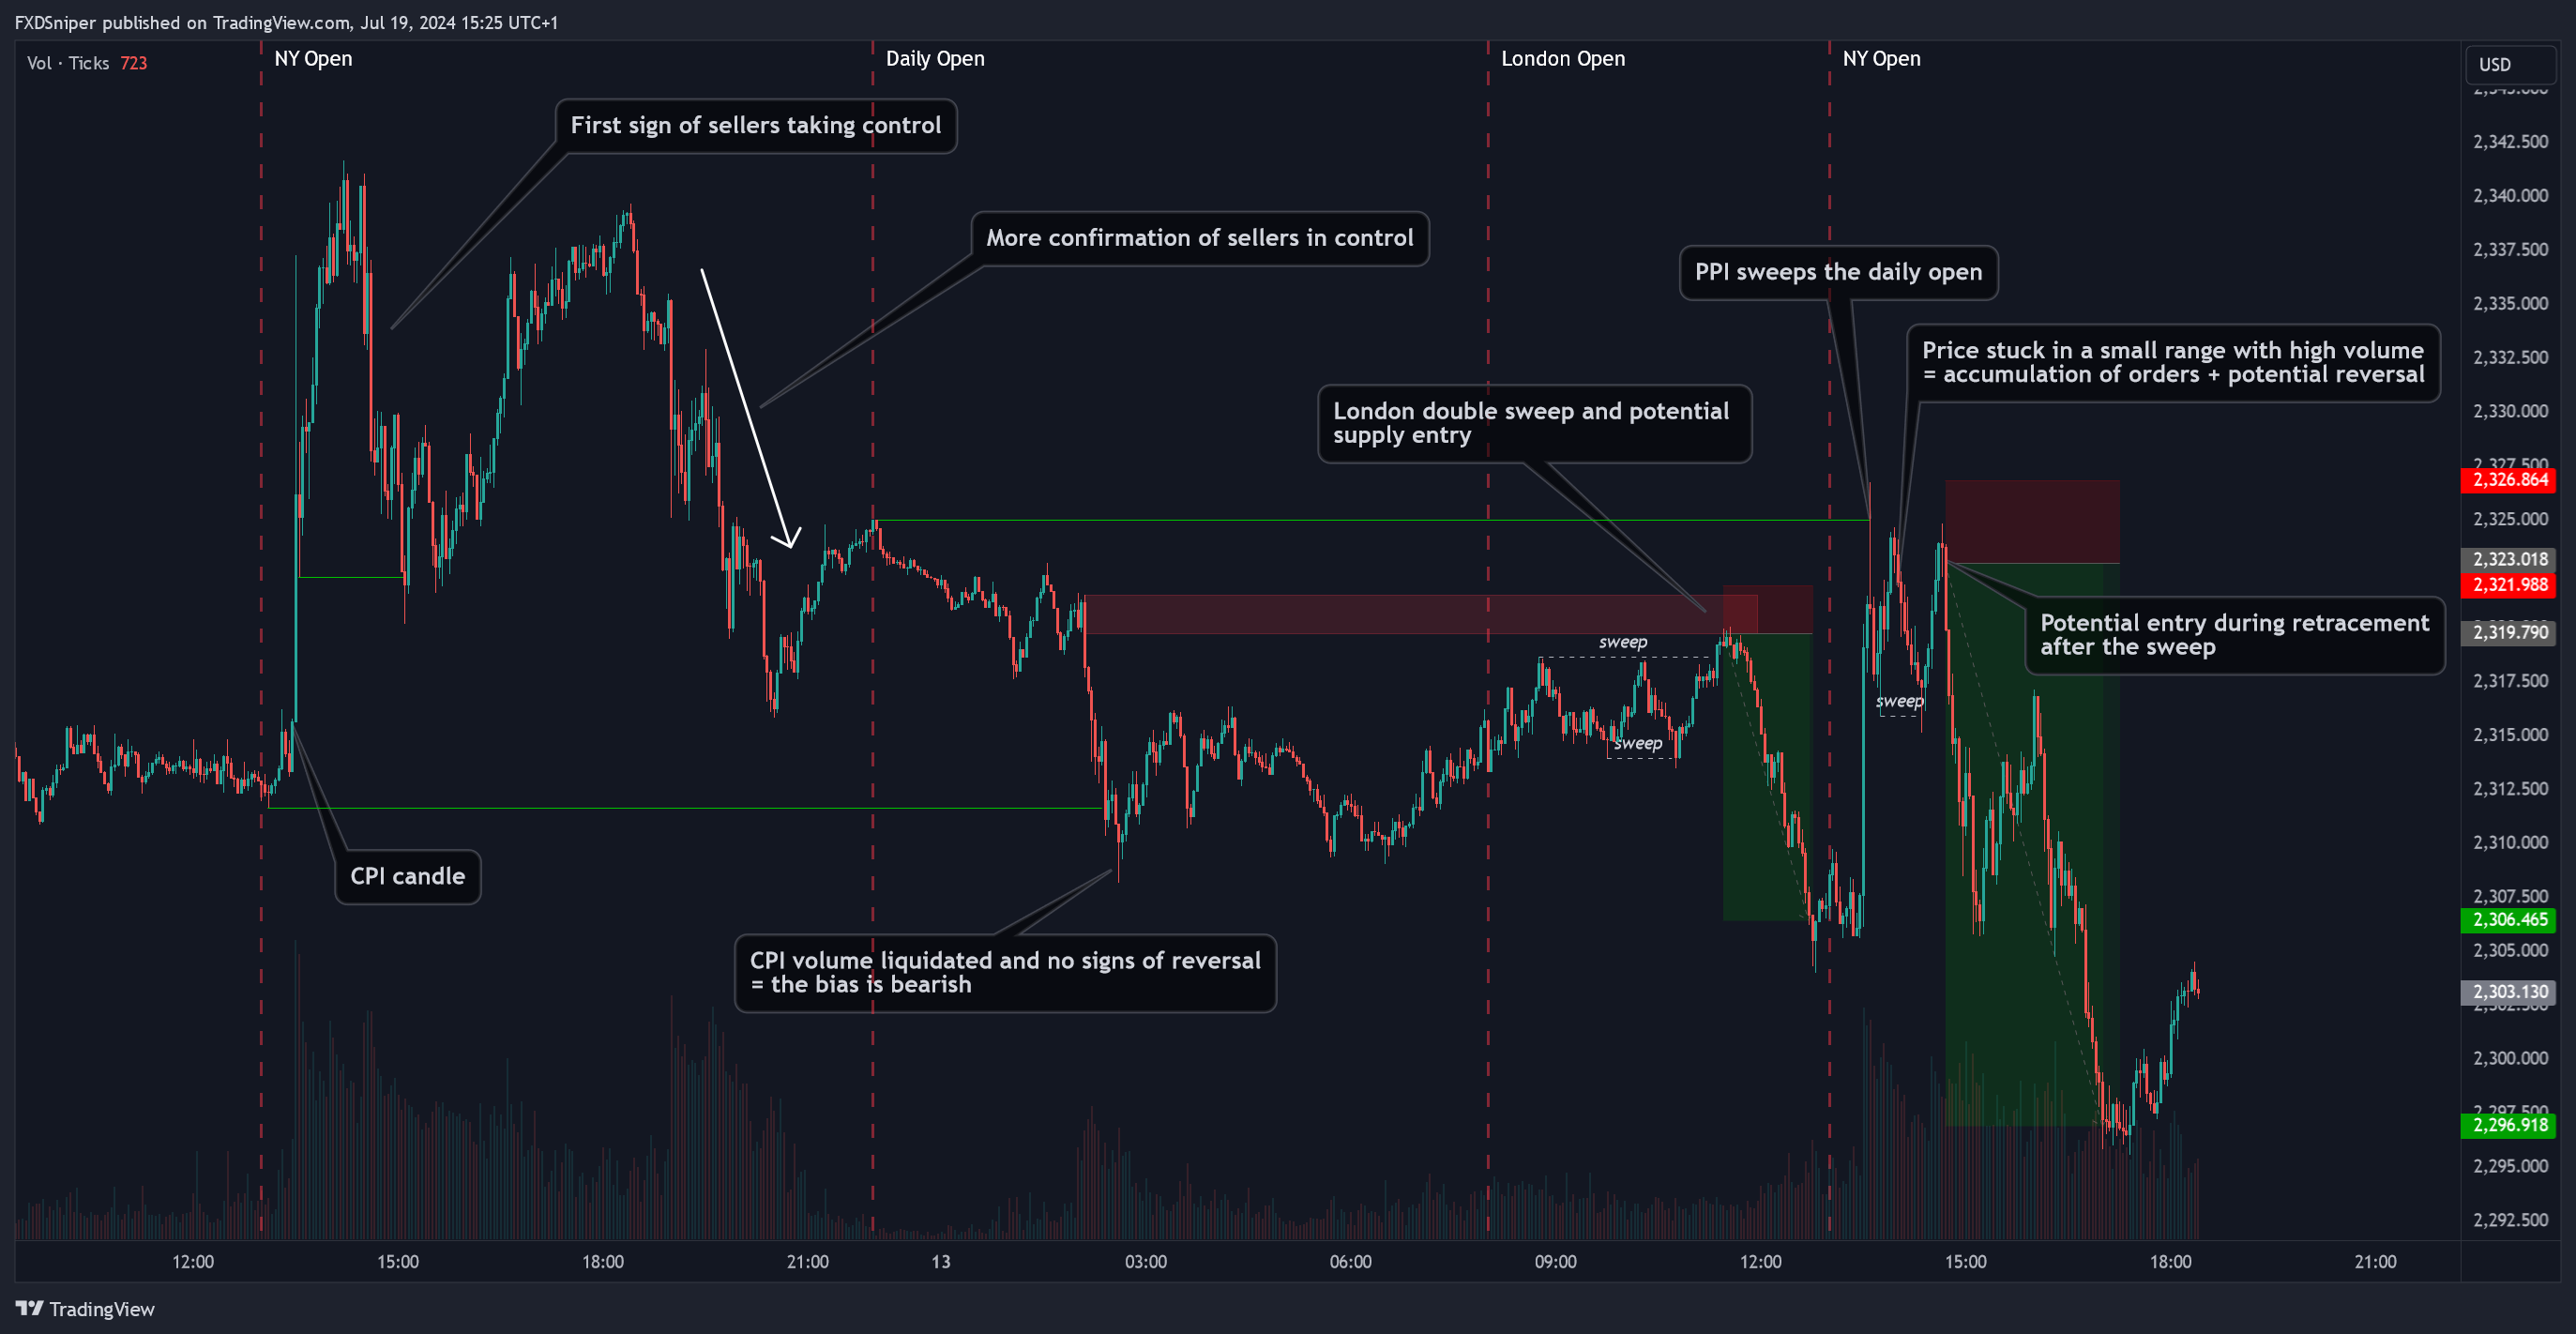
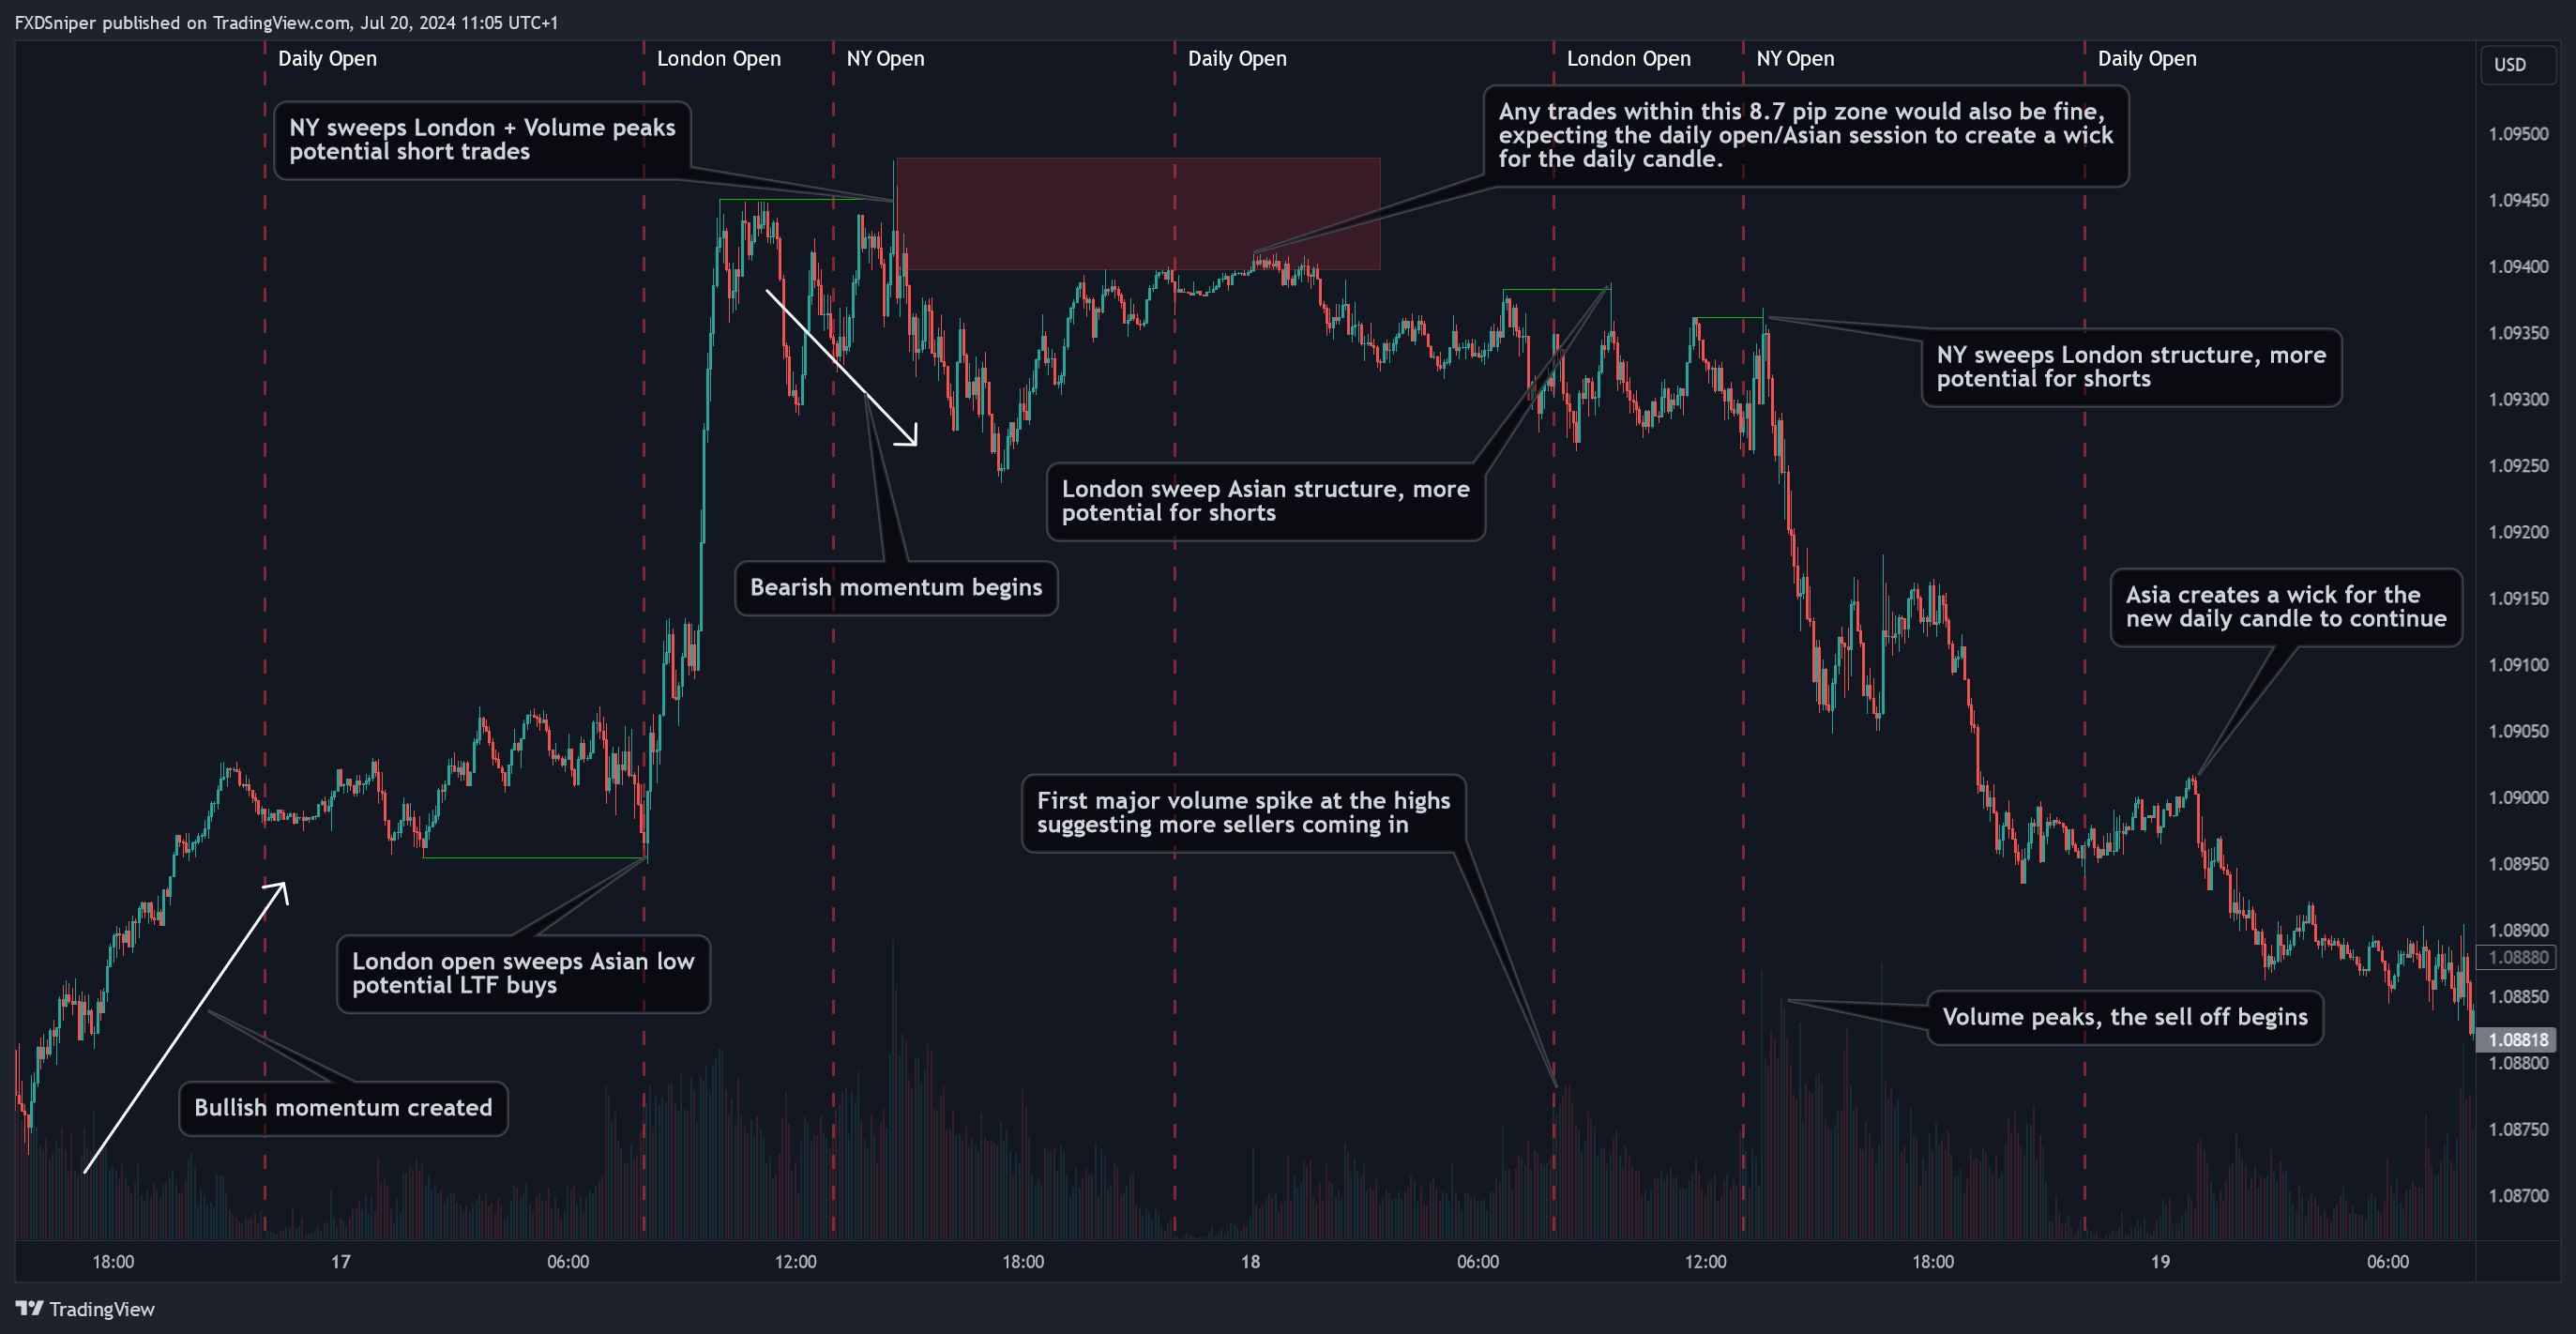
More trade scenarios below:
This is the end of this guide. There’s a lot more when it comes to understanding the markets but a lot of it you just have to figure out on your own. We all have a different perception of what we see and how we understand things. I can show you the blueprint but how you interpret it and use that information is up to you. Lot of the understanding will come naturally with experience and the amount of chart time you have. All I can say is pay attention to every move and try to find a reason for every major move in the market and just go from there. Use all the timeframes, study all the details and one day you’ll wake up, you’ll look at the chart and you’ll feel like you run the Matrix and you’ll be able to find every detail there is.
I also want to say I do not have any evidence of how the markets really work, how the algorithms control it or if anything I teach is actually real or if it’s my own delusion. Everything I’ve described here is just my own theories and conclusions I’ve come up with based on the facts that I do know and on my own experience trading almost every single day since 2018.
