Before we start I just want to emphasize that this is just a guide to trading news, DO NOT treat it as a guaranteed way to gamble during major news. No matter how good the setup looks, if the news comes out with an unexpected result it may blow your entire account within a second.
Everything explained here also doesn’t guarantee you will predict the news outcome every single time. Just because the news had the same outcome and reaction 5 times in a row and you predicted it perfectly it doesn’t mean the same thing will happen again. Usually in the days prior and on the day of the news you will see signs of what the markets may do but you may miss something in your analysis, or you took a loss the day before and now your judgment is compromised. Everything you did before also has an impact on what you will do next. This guide is mainly to give you an idea of what happens during news and to stop you being afraid of trading during the news or holding trades through the news.
I will break down most major news for USD, GBP, EUR, JPY, AUD and CAD from a technical point of view and how the price behaves before, during and after the news are released. I won’t be explaining the fundamental aspects of these news as it’s not my expertise, you can use ForexFactory to find out the basic meaning behind each event, I will only show you what the charts tell you and how to capitalize on the extreme volatility the news provides. I will also only focus on what happens with the major forex pairs + gold.
The major forex news events are:
- Non-Farm Payrolls (NFP) – Typically released on the first Friday of each month, this report indicates the number of jobs added or lost in the US economy over the past month, excluding the farming industry.
- Federal Reserve Meetings/Announcements – Includes interest rate decisions, policy statements, and the Fed Chair’s press conferences. The Fed’s decisions on monetary policy are crucial for the USD.
- Gross Domestic Product (GDP) – Quarterly data that shows the pace at which the US economy is growing or shrinking.
- Consumer Price Index (CPI) – This monthly inflation data shows the change in the price of goods and services from the consumer perspective.
- Retail Sales – A monthly measurement of all receipts from stores in the US. It’s a primary gauge of consumer spending, which accounts for the majority of overall economic activity.
- Unemployment Rate – Released alongside the NFP report, it measures the percentage of the total workforce that is unemployed and actively seeking employment during the previous month.
- FOMC Minutes – Provides a detailed record of the Federal Reserve’s policy-setting meeting, offering in-depth insights into the economic conditions that influenced their votes on interest rates.
- ISM Manufacturing PMI – This monthly index measures the general direction of production in the manufacturing sector. A reading above 50 indicates expansion; below 50 indicates contraction.
- PCE Price Index – Personal Consumption Expenditures Price Index is another inflation indicator watched closely by the Federal Reserve to gauge price pressures in the economy.
- US Treasury Currency Report – Although less frequent, this report can have significant implications for the USD as it details international economic and exchange rate policies.
- Durable Goods Orders – This report measures the change in the total value of new orders for long-lasting manufactured goods. It gives insights into manufacturing strength and consumer confidence.
- Consumer Confidence Index – A survey that assesses how optimistic or pessimistic consumers are regarding their expected financial situation. This can influence consumer spending, which drives a large part of the economy.
- Producer Price Index (PPI) – Similar to the CPI, the PPI measures the change in the selling prices received by domestic producers for their output. This is another key indicator of consumer inflation.
- Initial Jobless Claims – Weekly data that counts the number of people filing for state unemployment benefits. It is a good early indicator of the job market’s health.
- Federal Budget Balance – Shows the difference between the federal government’s income and spending during the reported month.
- Trade Balance – Measures the difference in value between imported and exported goods and services over the reported period. A significant deficit can devalue a currency.
- Home Sales – Includes reports like New Home Sales and Existing Home Sales. These indicators measure the health of the residential real estate market.
- Business Inventories – The dollar value of unsold goods on hand. This can indicate future business activity as companies adjust their inventory levels based on market conditions.
- Beige Book – Published by the Federal Reserve, this report is a summary of economic conditions in each of the 12 Federal districts in the U.S. It is used during FOMC meetings to guide monetary policy decisions.
- Political Events – Elections, significant policy changes, or geopolitical tensions can also cause substantial volatility in the USD and other currencies.
Of course I’m not going to break down every single one of them. Most of them don’t actually have a huge impact on the market so I’ll only focus on the ones that do impact the market during its release or the ones you see most often on ForexFactory.
Let’s start with the main one.
NFP
NFP is always released on the first Friday of the month so as soon as a new month starts you should be prepared and expect more manipulation than usual. This is a USD only event so of course the DXY and all USD will experience the biggest impact but it does impact the entire forex market. Also the Unemployment Rate numbers are always released at the same time.
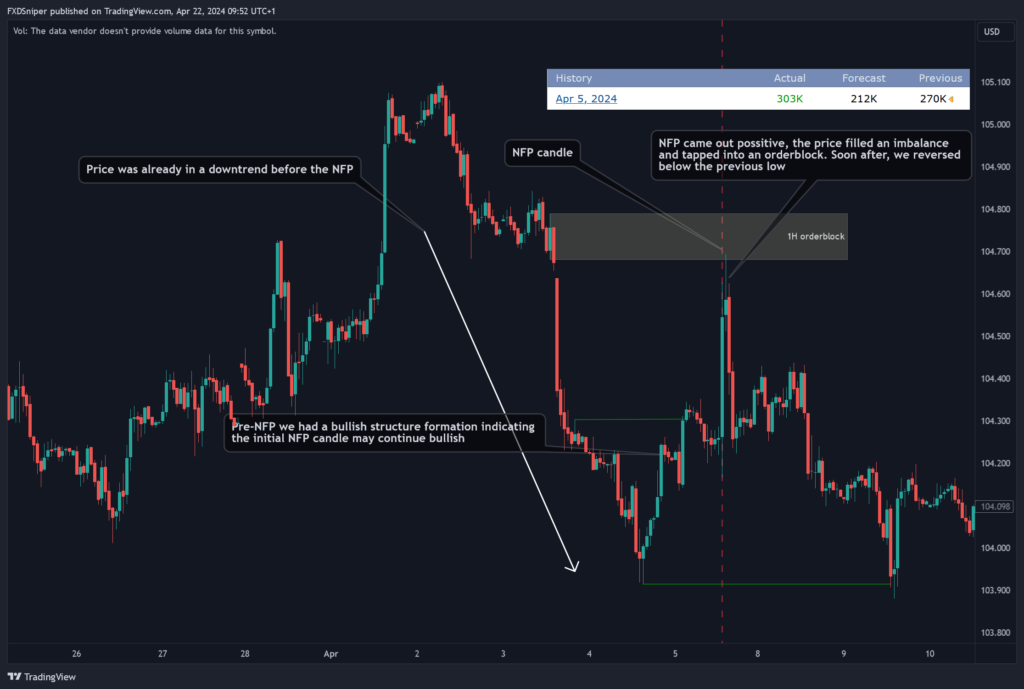
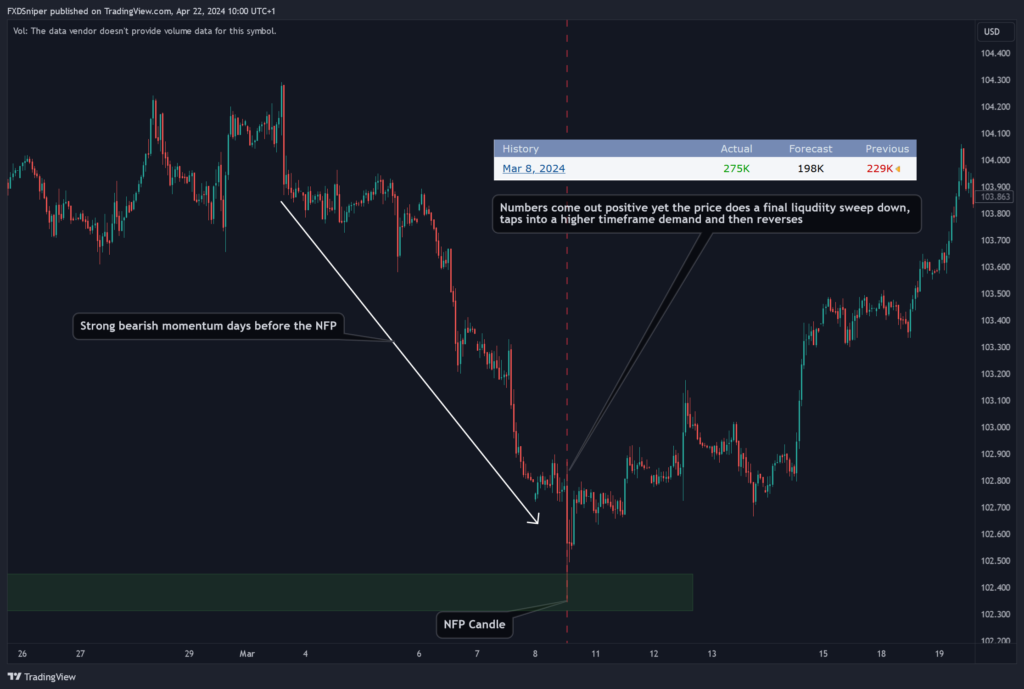
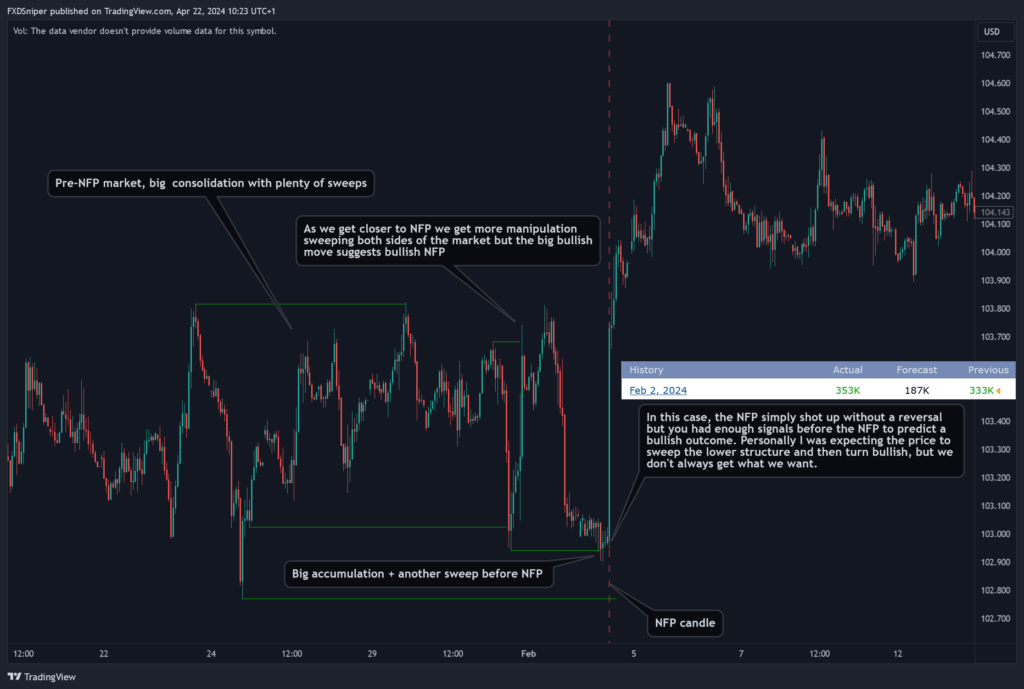
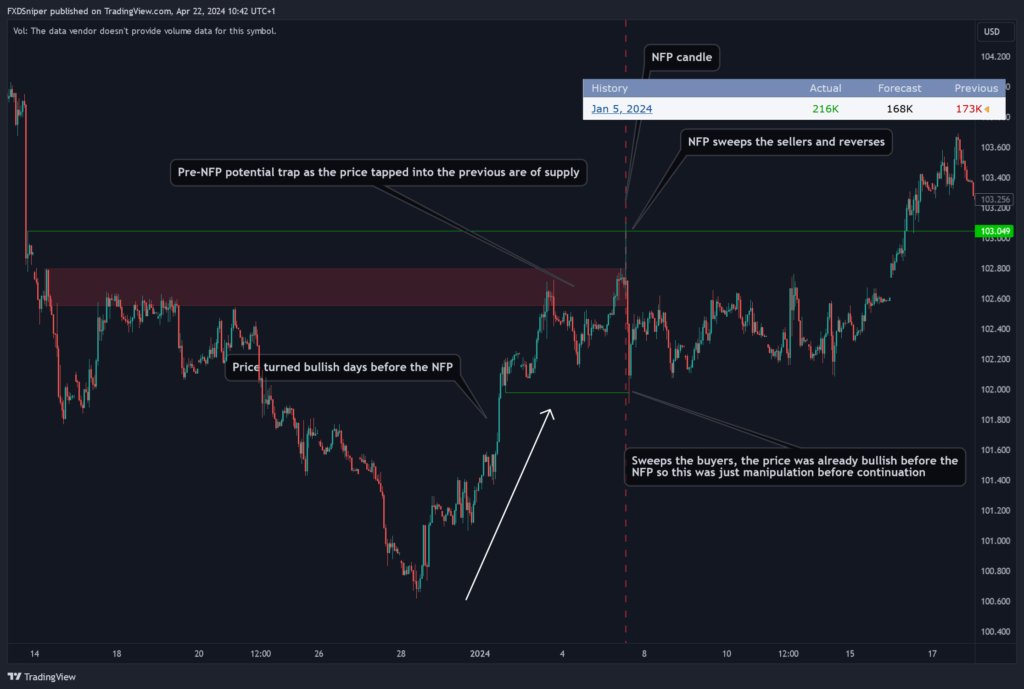
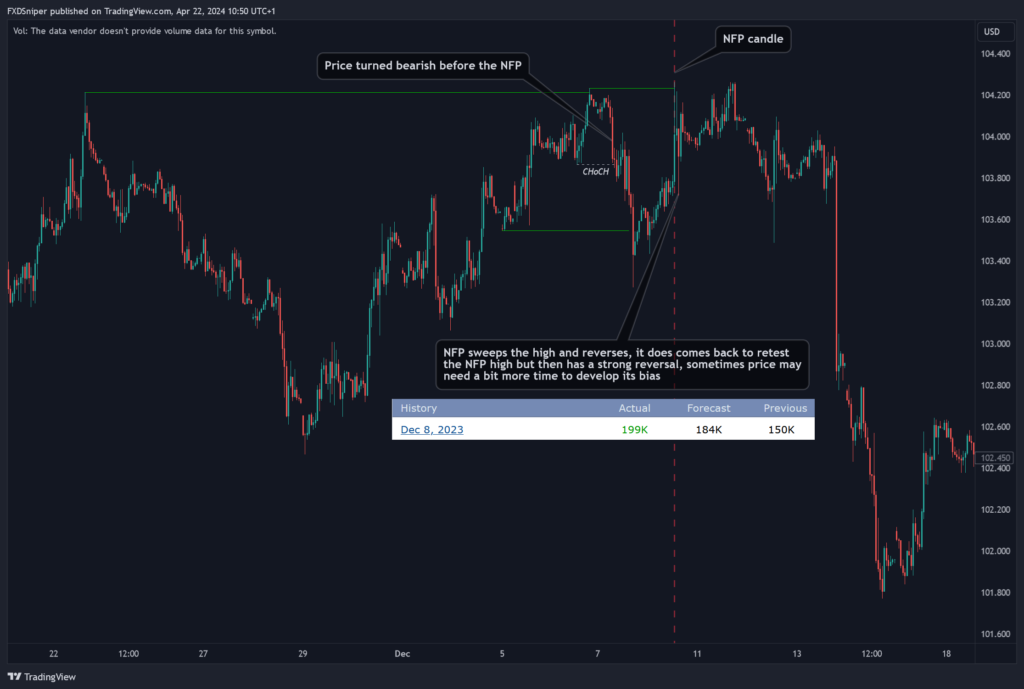
The main behavior of NFP is that 9/10 times it will go the opposite way to the initial news candle. So if the price went up as the news got released, after enough orders have been accumulated by the market makers the price will reverse, no matter what numbers came out. Of course you can’t expect the same thing to happen every time so you have to make up your decision before the news are released and simply react to what happens but usually the price action before the release will at least give you an idea of what’s about to happen.
Let’s look at some examples:
Notice as the “Actual” number released is closer to the “Forcast” number, the initial volatility is much smaller compared to numbers that have a much bigger gap between the two. Also notice that after the NFP the next few days usually have very little movement but you can expect the price to continue with the bias created by the NFP. However often you may notice that the following week will sweep the original NFP move and then continue with the bias.
You will always find an explanation for the price’s movements, if you can’t find a reason, look again.
You should always keep an eye on the DXY if you’re looking to trade the news.
If DXY goes up:
USD/xxx pairs will go up.
If DXY goes down:
xxx/USD pairs will go down.
If you’re trading GBP/JPY, EUR/JPY or other JPY pairs that are not paired with the USD, you should expect less volatility than pairs that are paired with the USD.
If the DXY goes up the JXY(Japanese Index) will go down. So:
JPY/xxx goes down.
xxx/JPY goes up.
With Gold it’s a bit tricky as it can do both regardless of what the DXY is doing but usually it will follow the same format as mentioned above. If you’re trading gold during NFP the key thing is to note that price will do the opposite of what the initial NFP candle did.
CPI
CPI is more fun to trade if you’re on the right side of the trade. If you’re on the wrong side you may experience some of the biggest losses of your career.
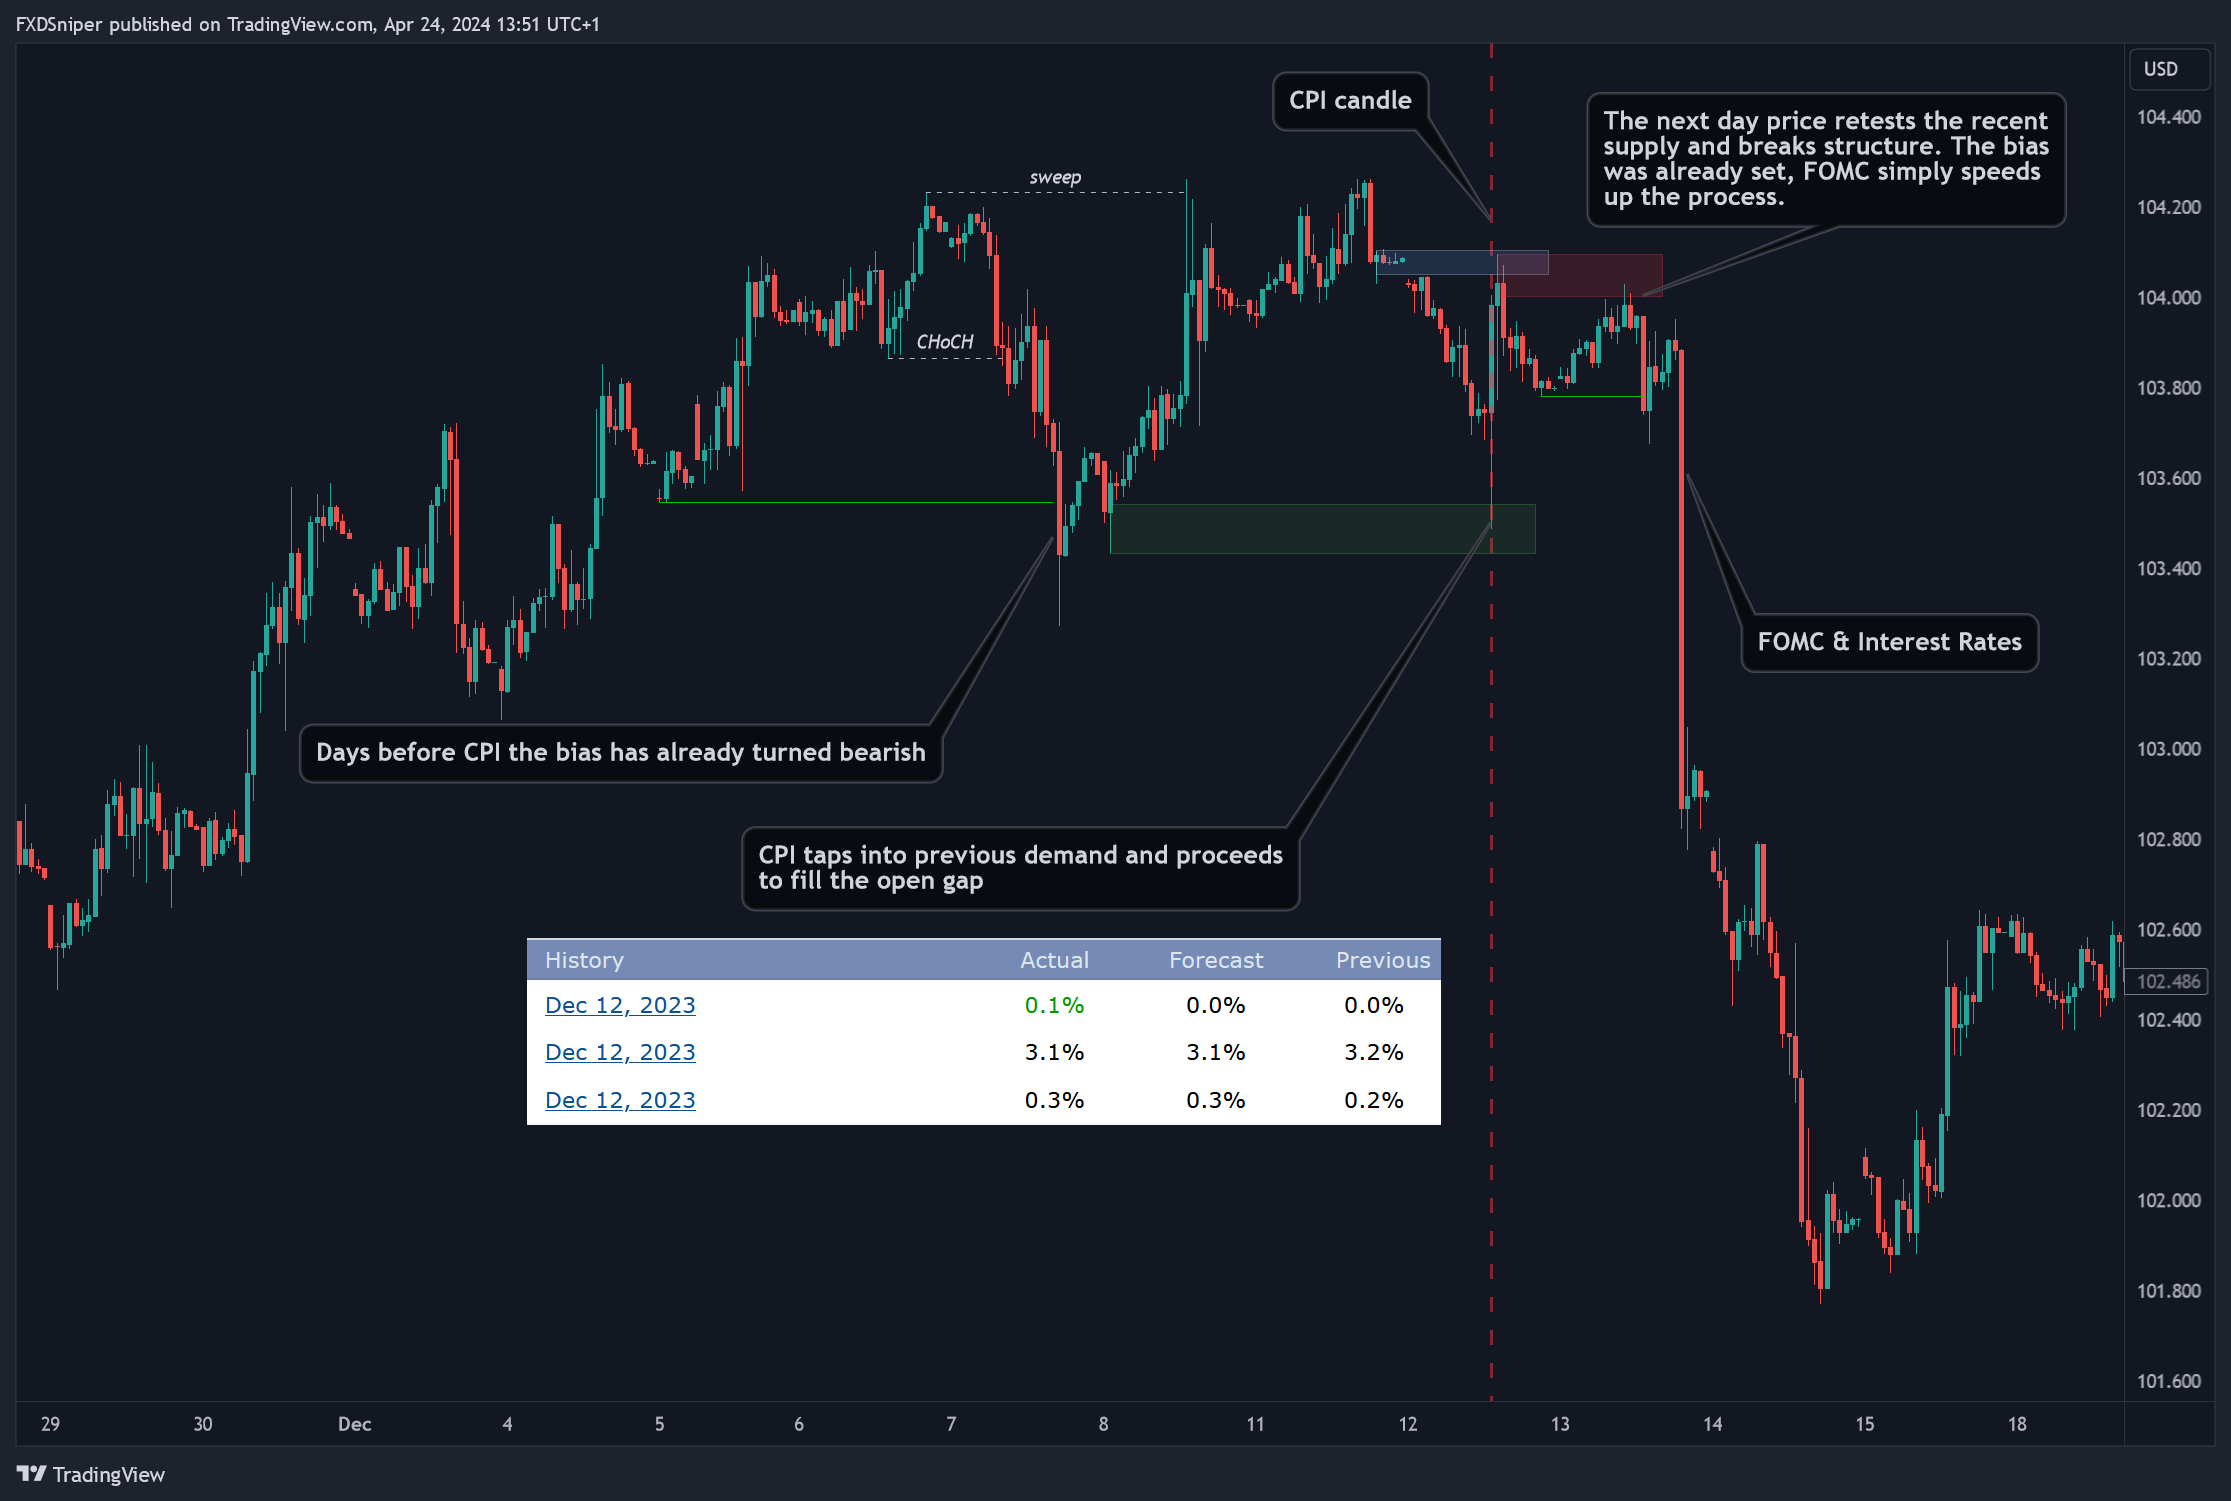
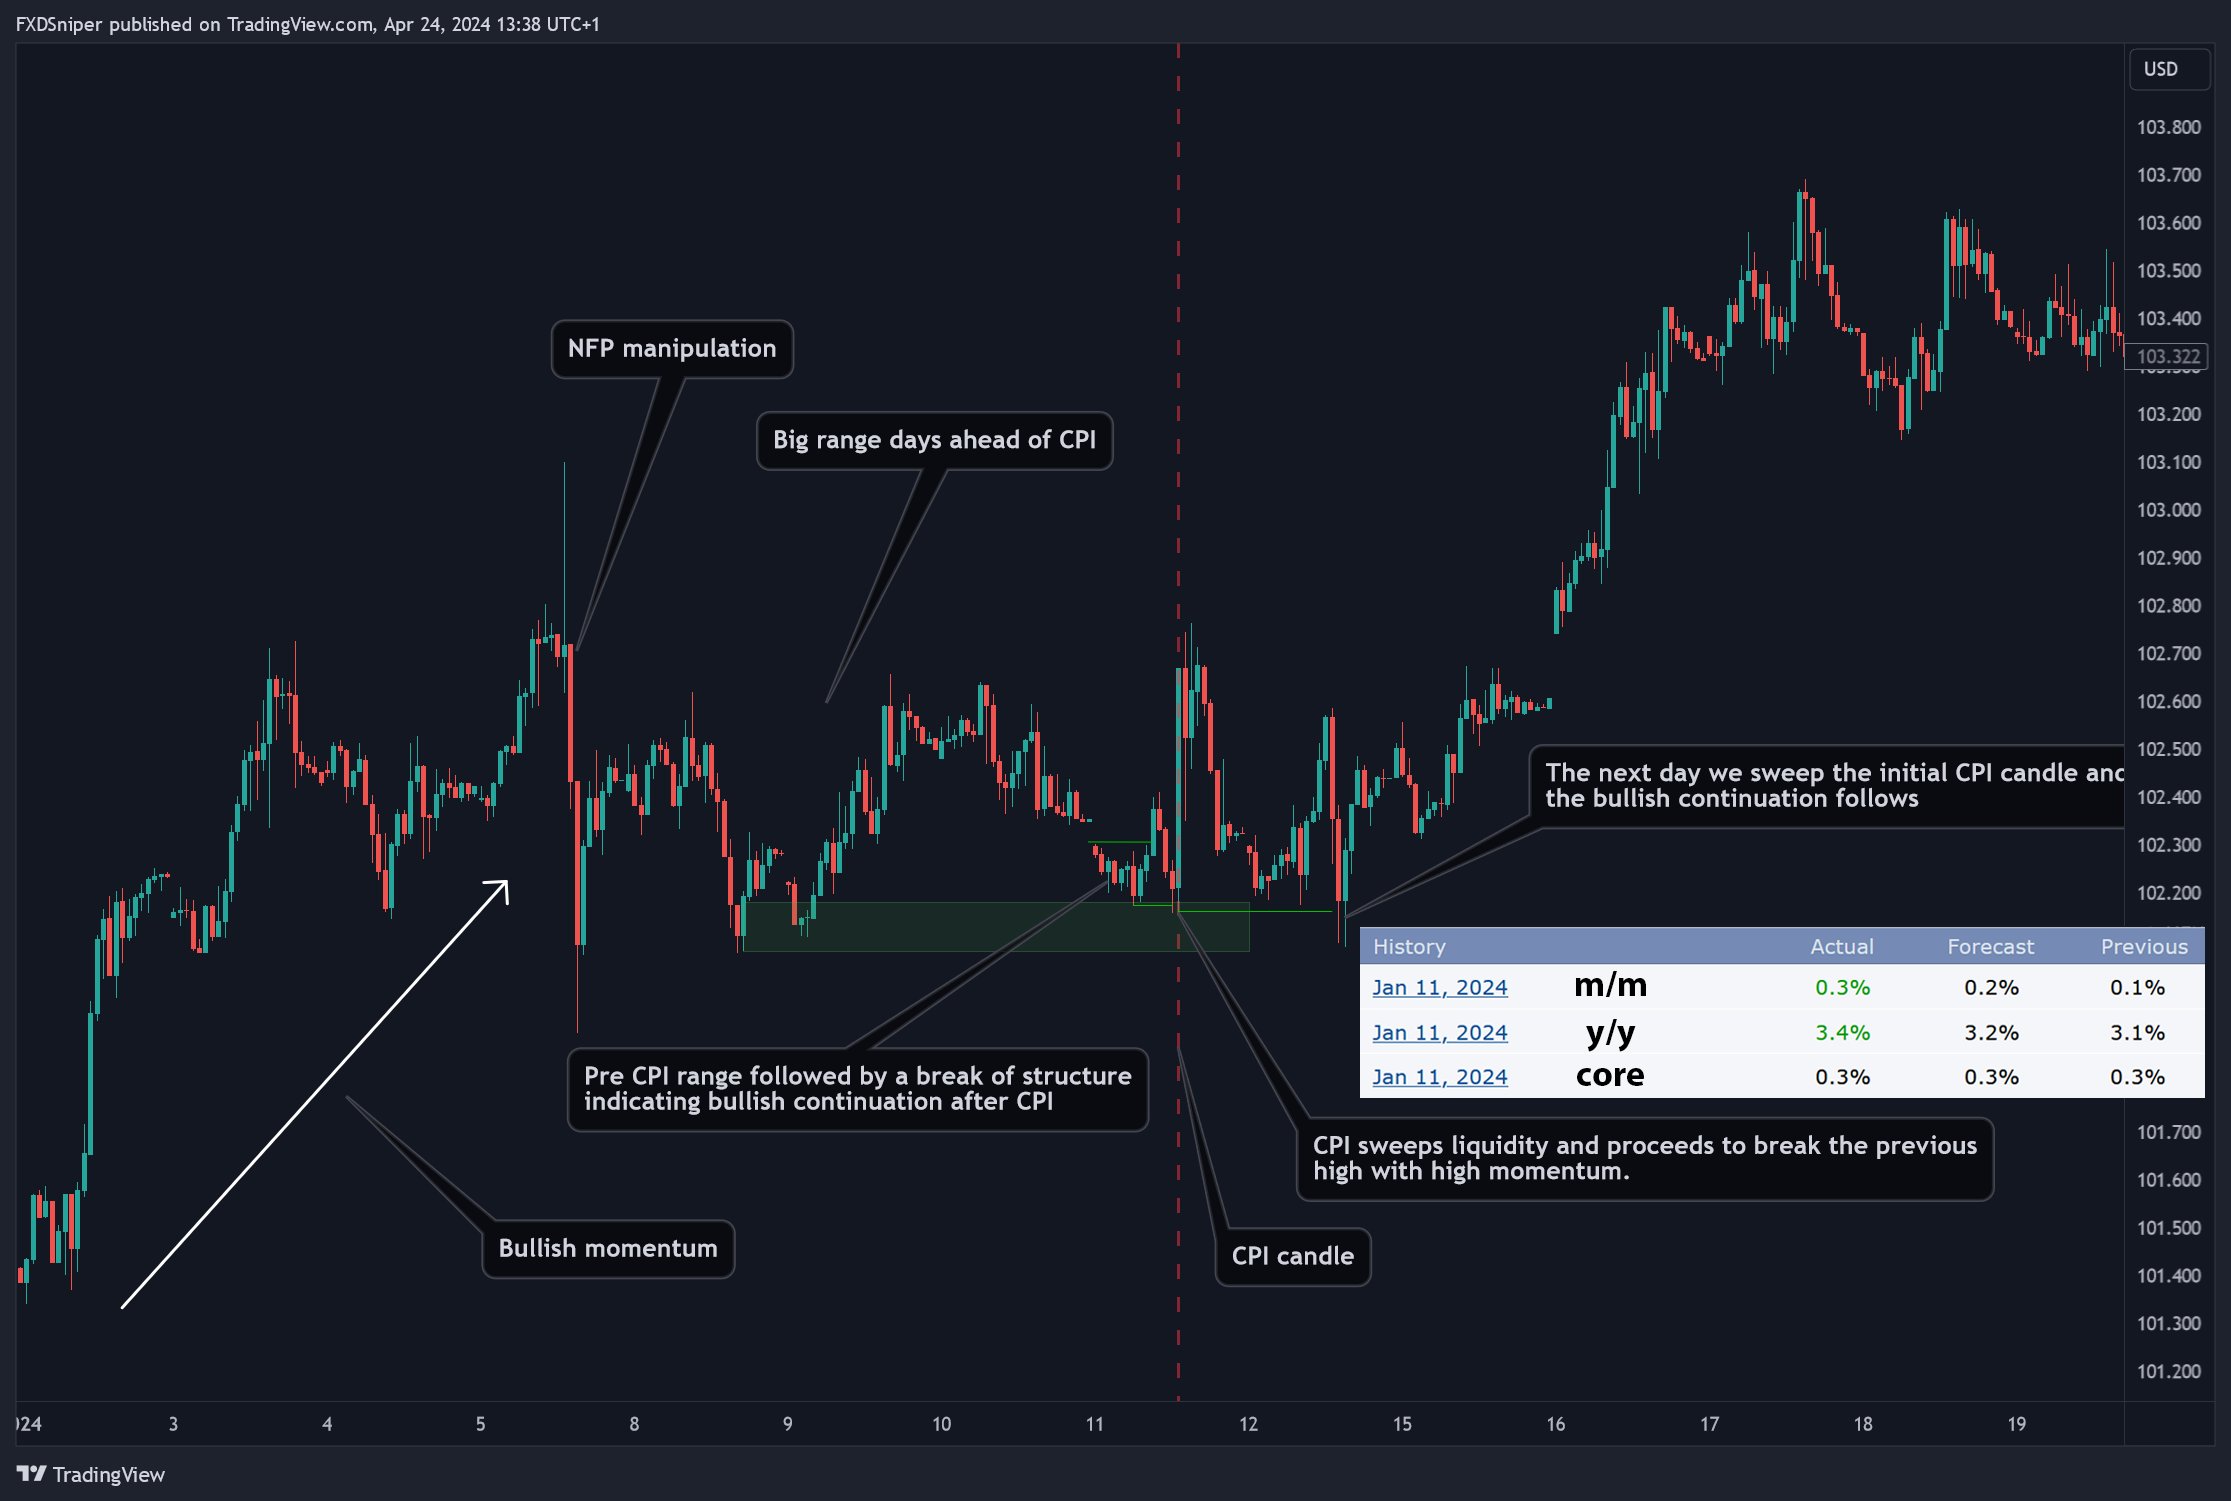
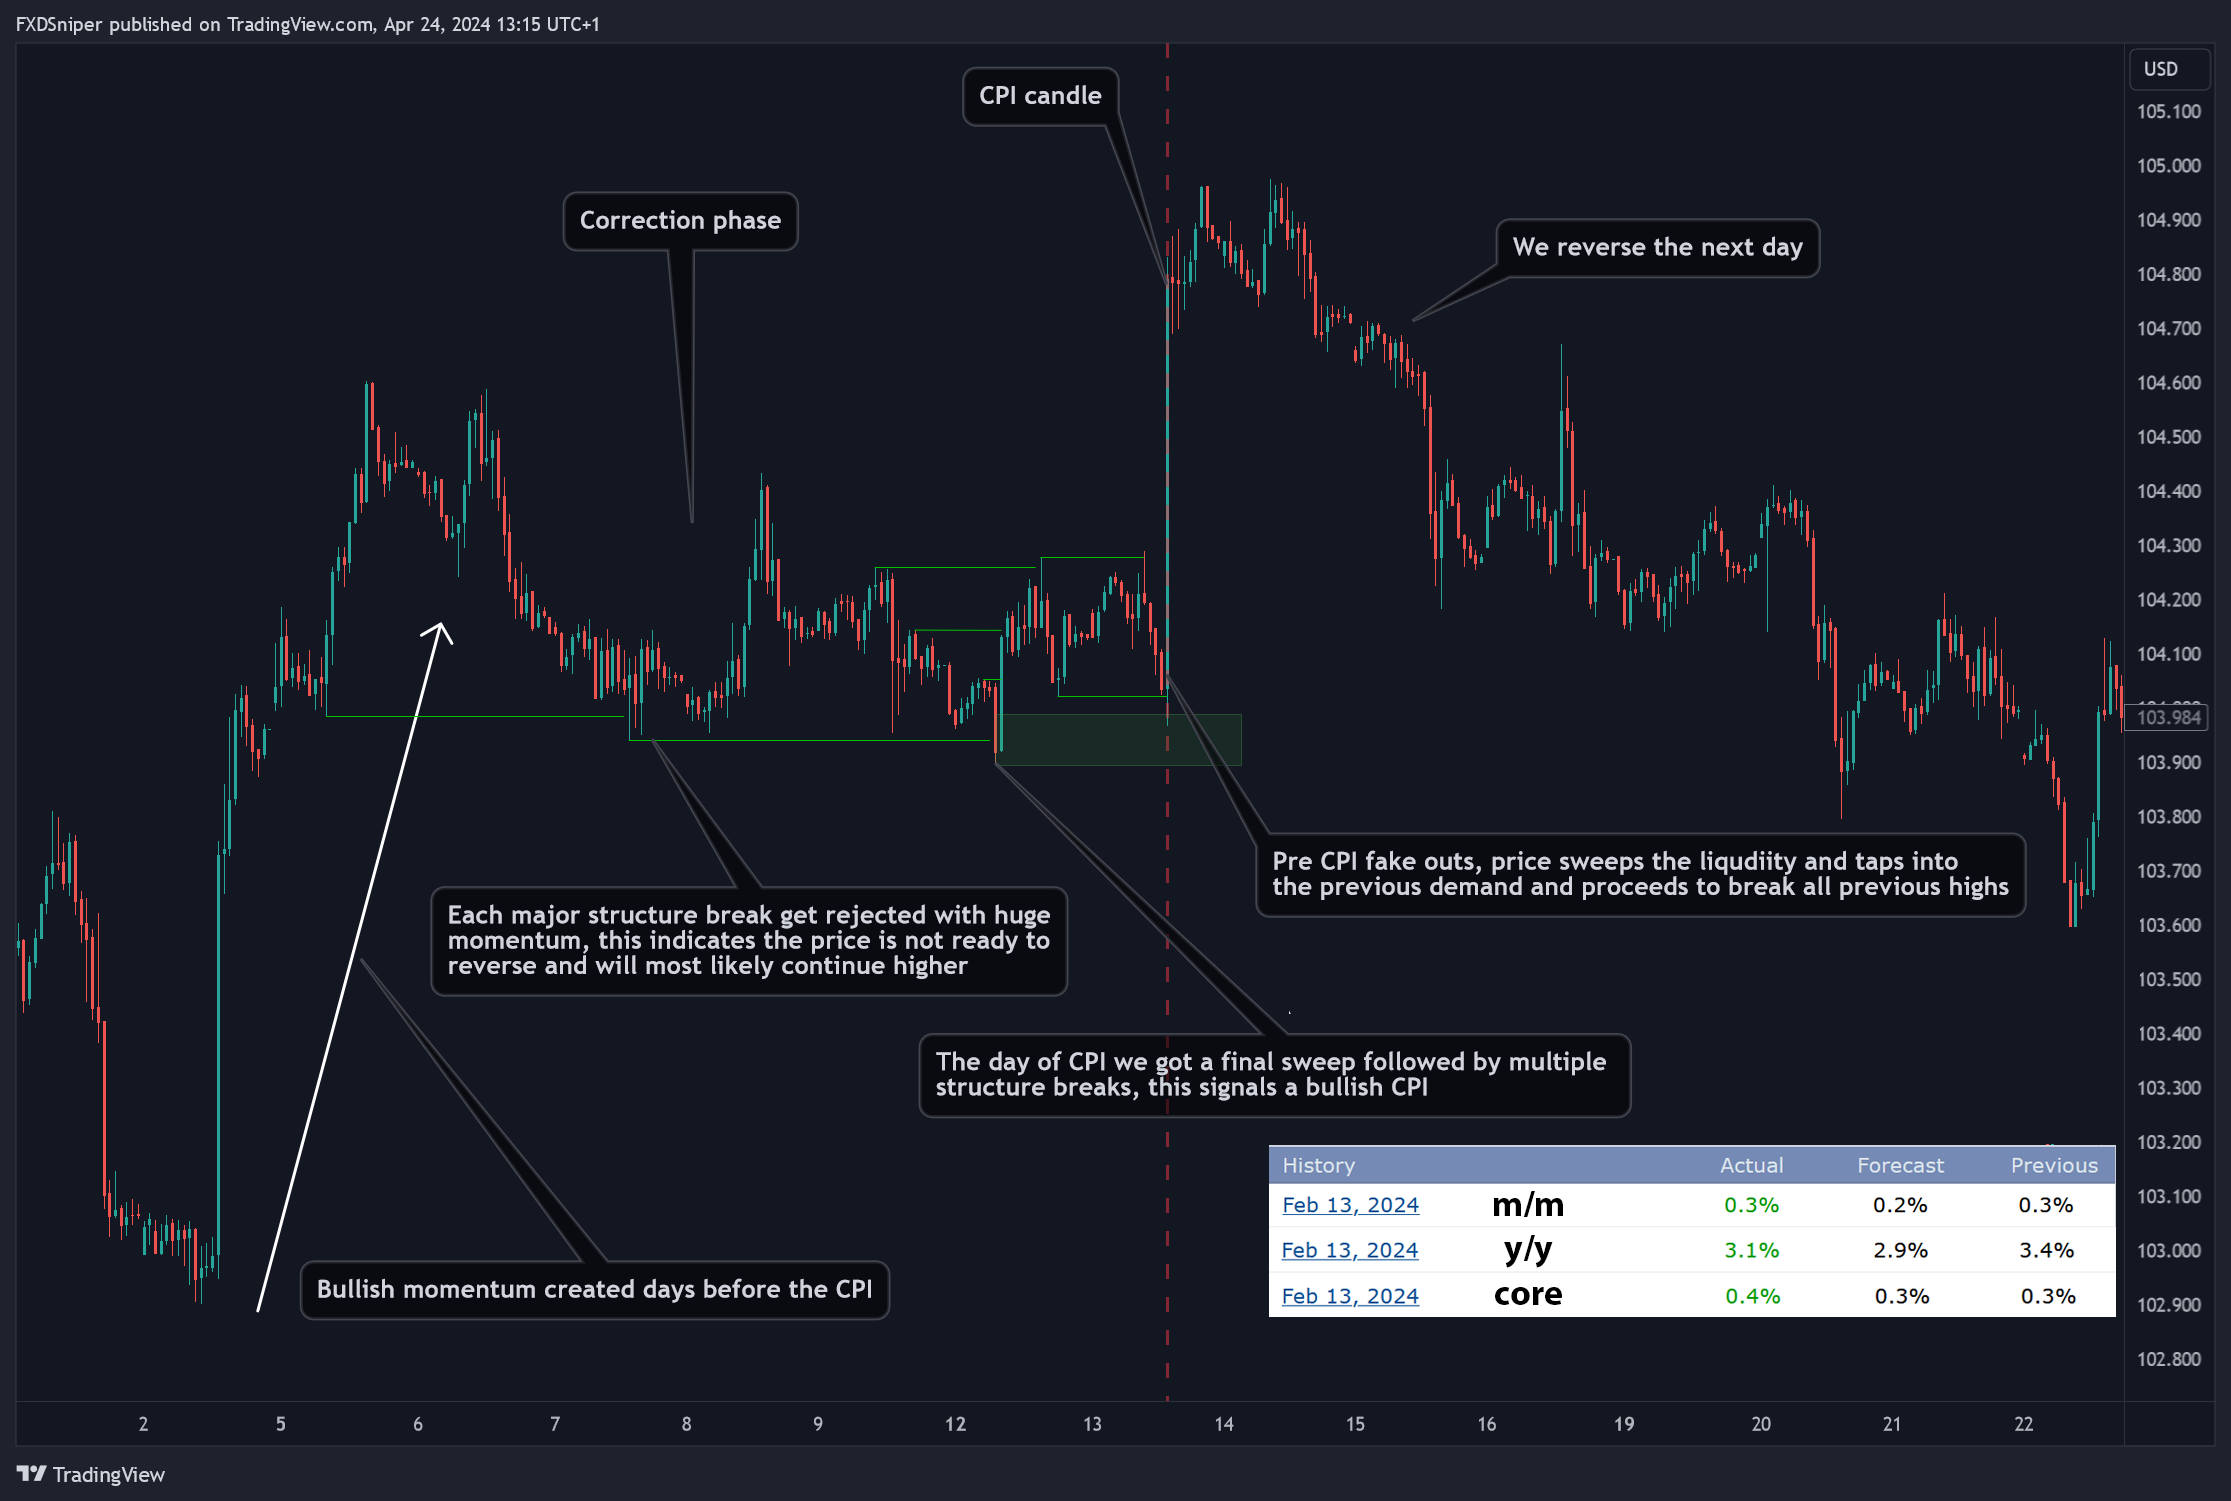
The reason for this is because CPI tends to just go one way without stopping(of course it’s very likely it will reverse days after but on the day of CPI it just tends to move one way). So if you’re on the wrong side and you decide to trade without a stop loss, you’re doomed. But if you hit a winner, that may be some of your best trades ever. This is why I prefer trading during CPI rather than NFP. NFP is easier to trade though.
There are 3 types of CPI, core CPI, monthly and annual. All 3 are released at the same time, CPI is released monthly, usually on Tuesday, Wednesday or Thursday on the 2nd full week of the month.
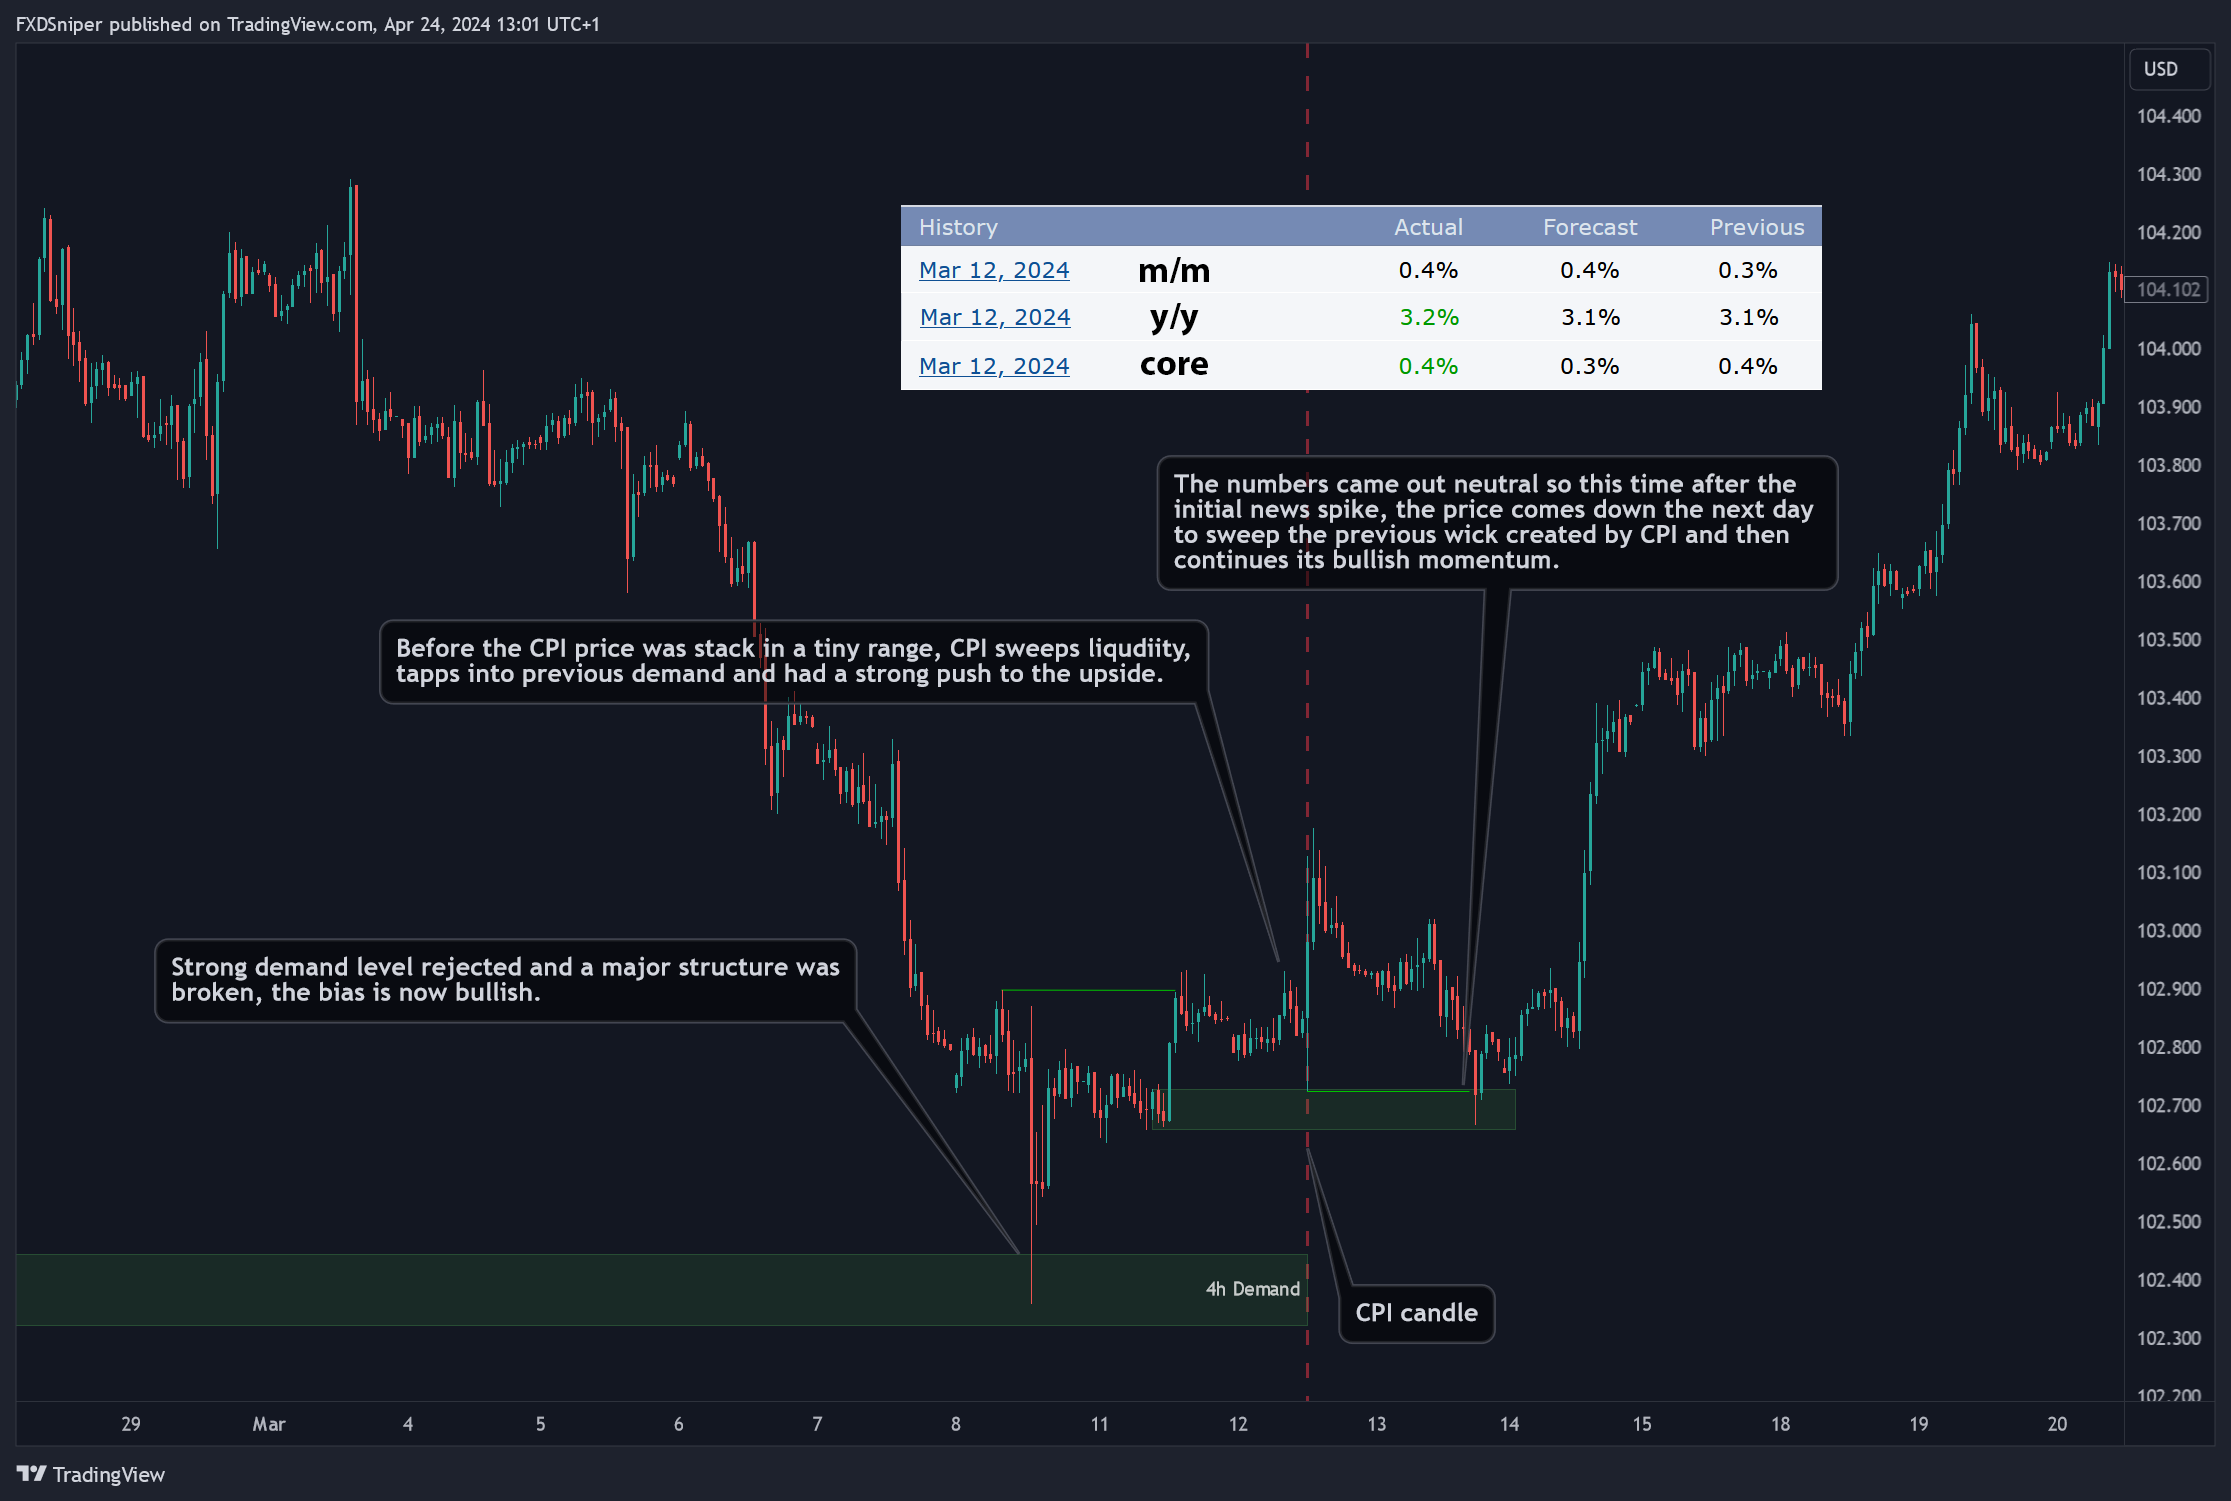
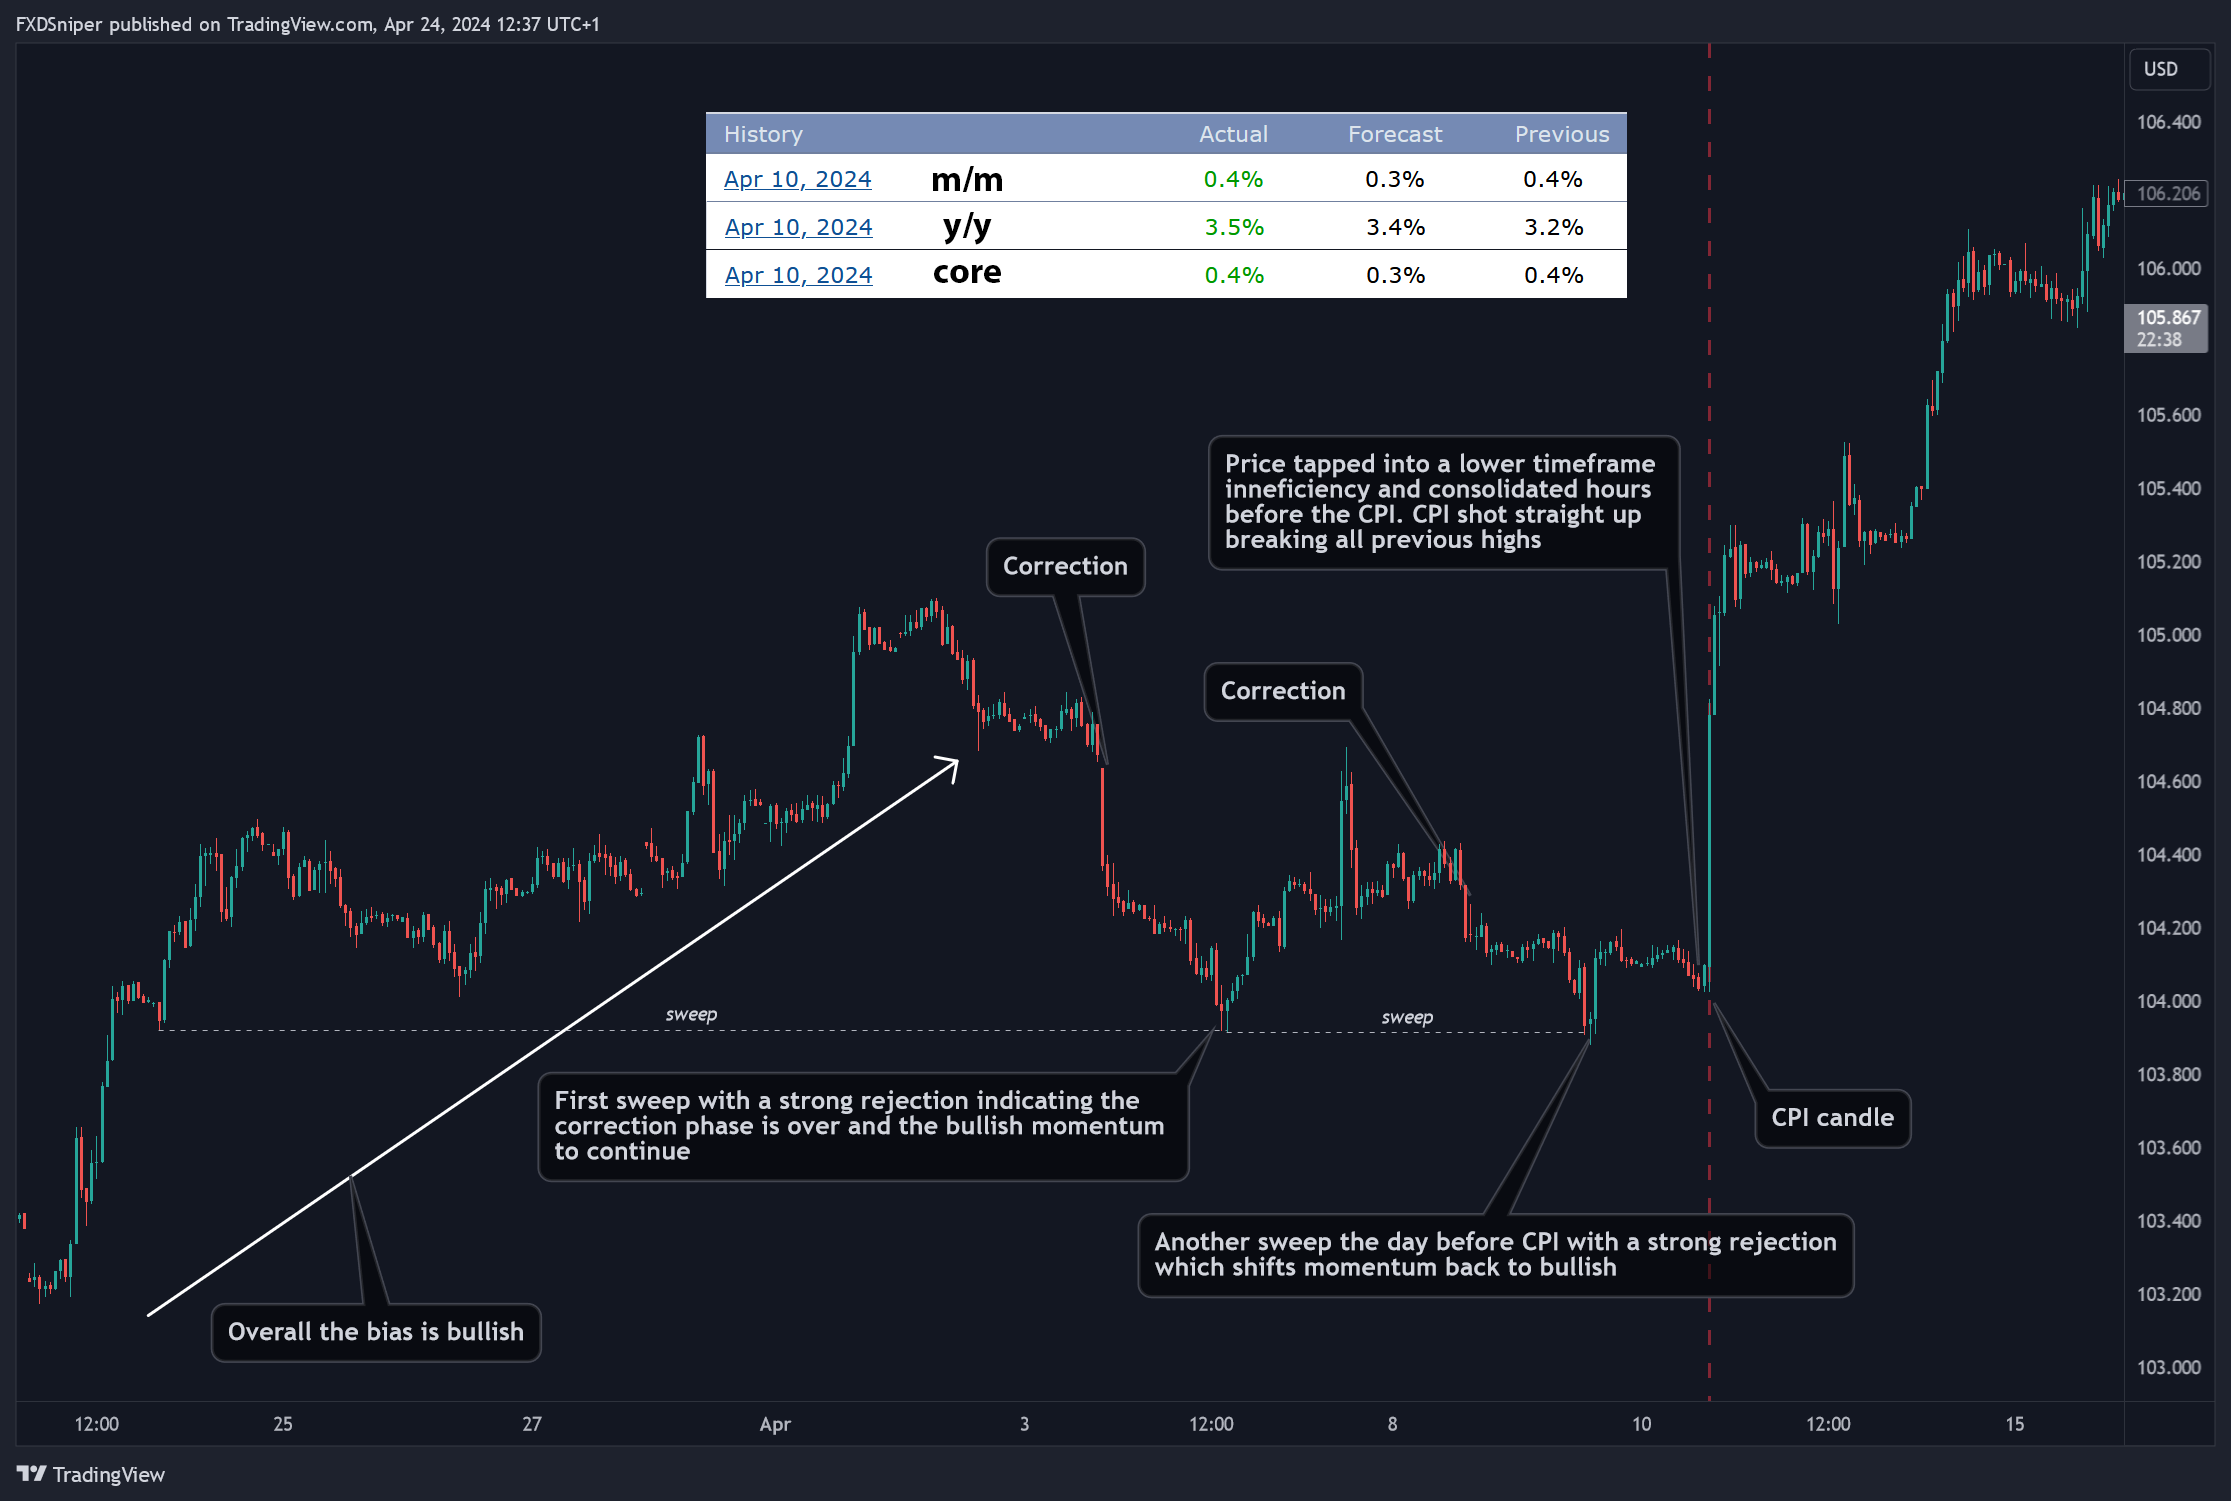
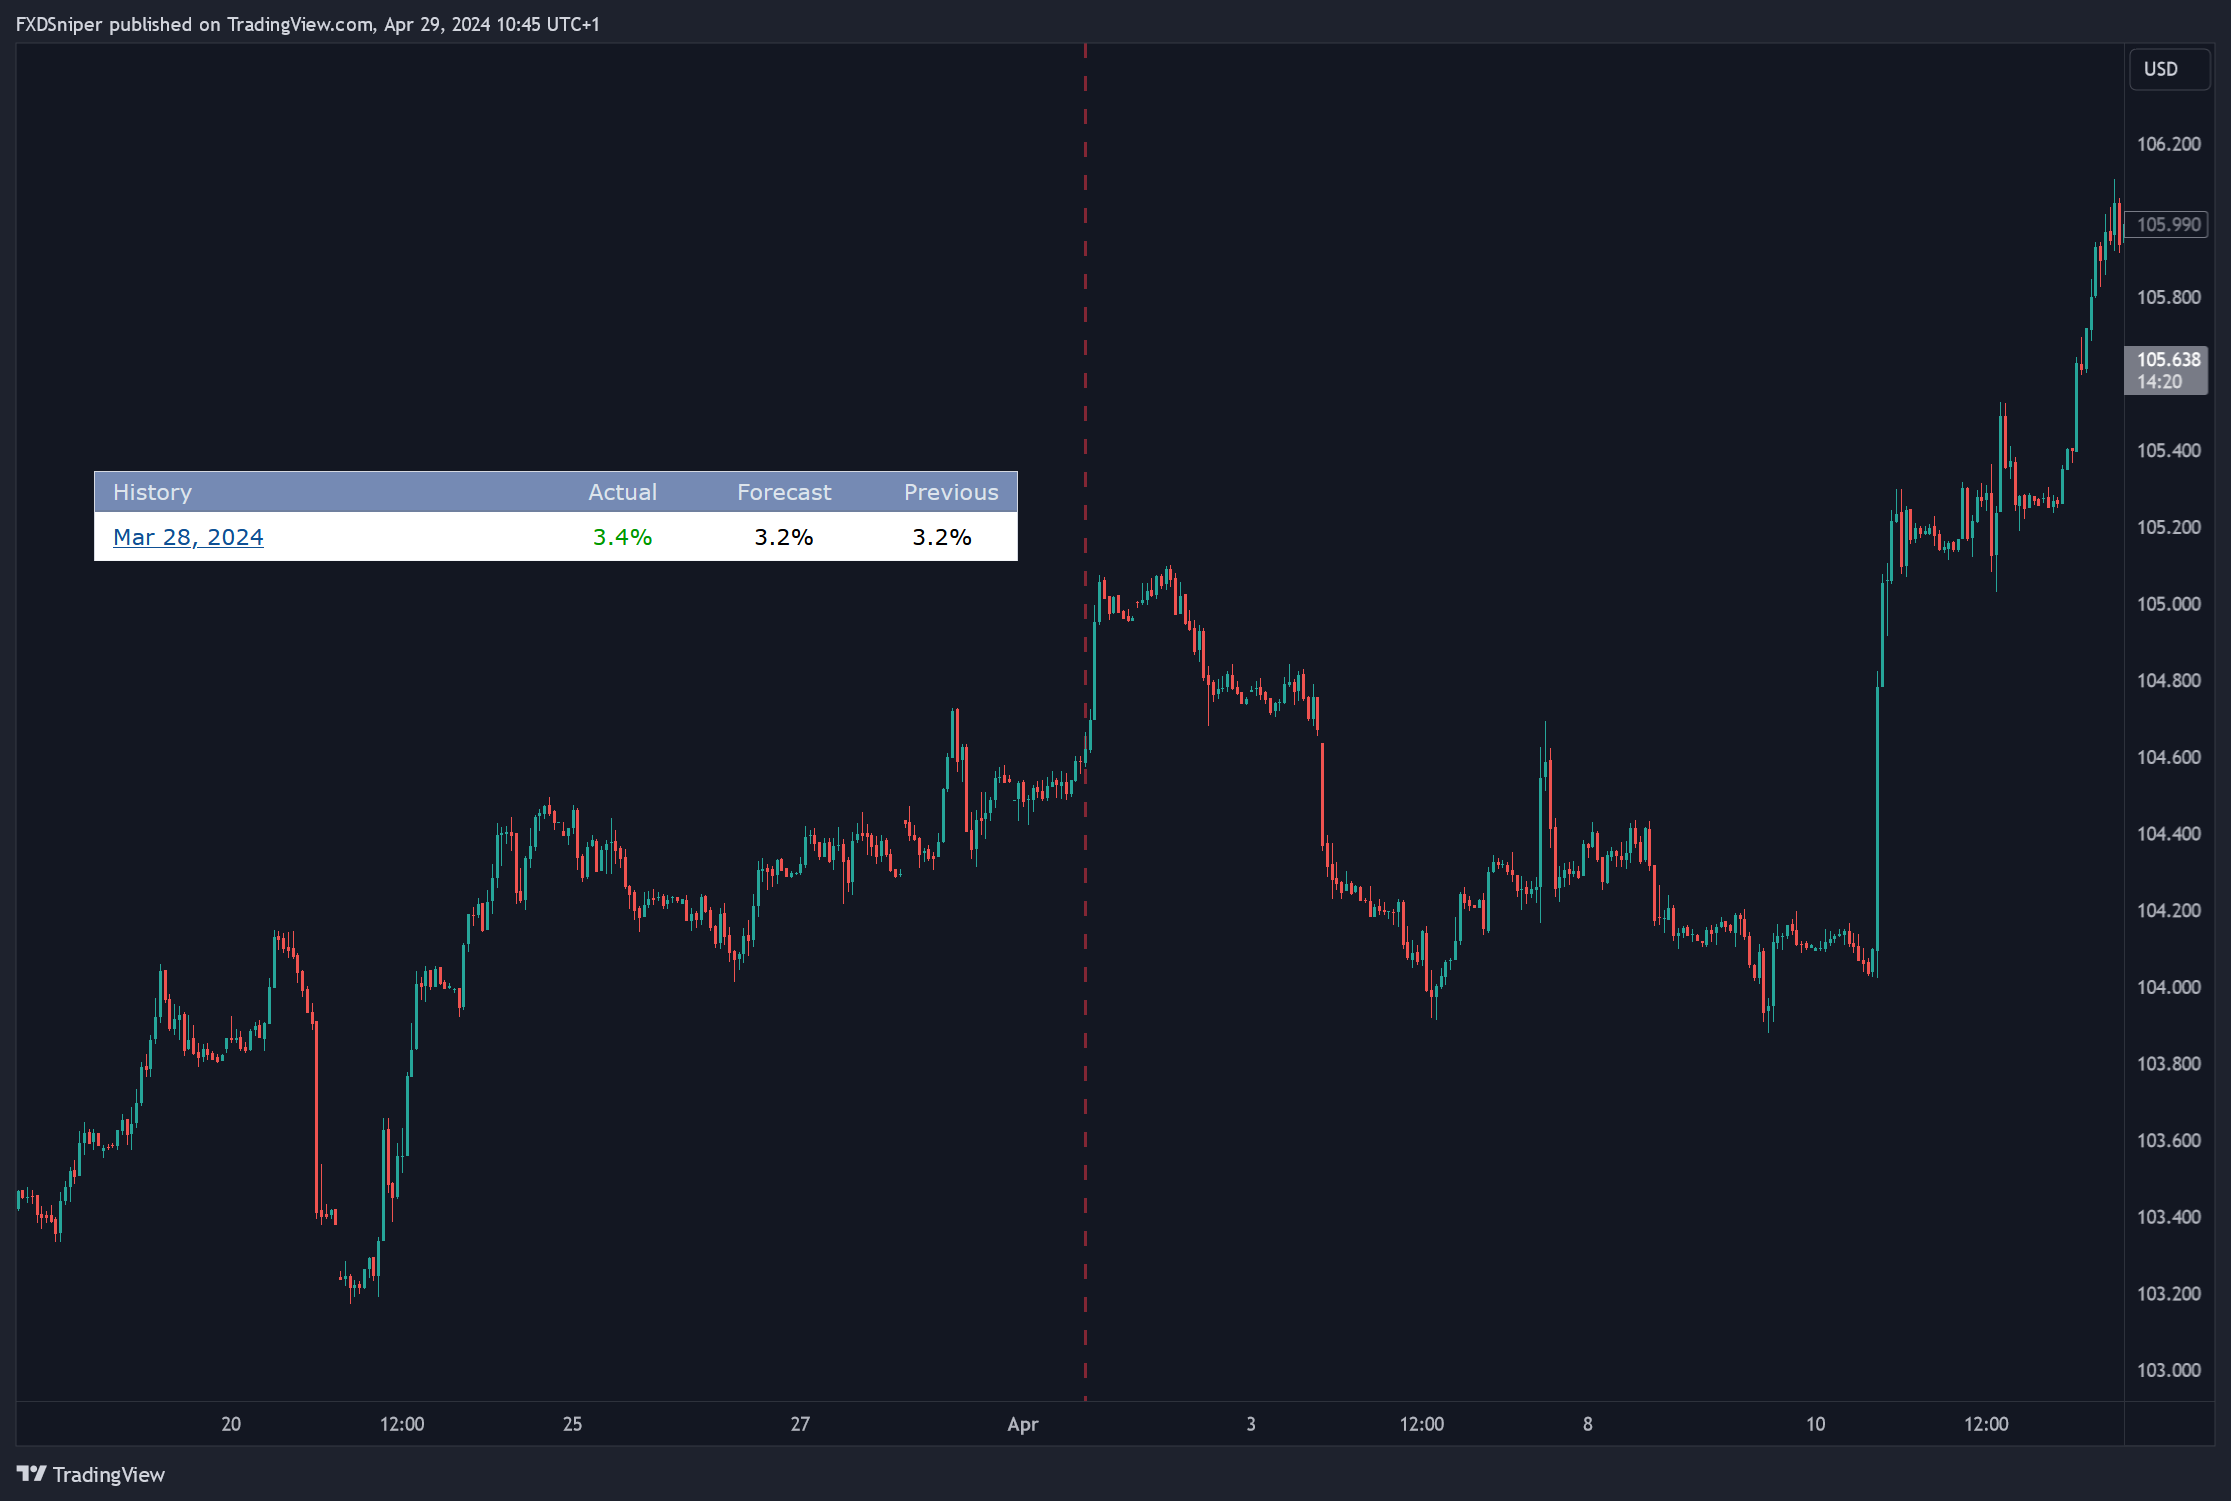
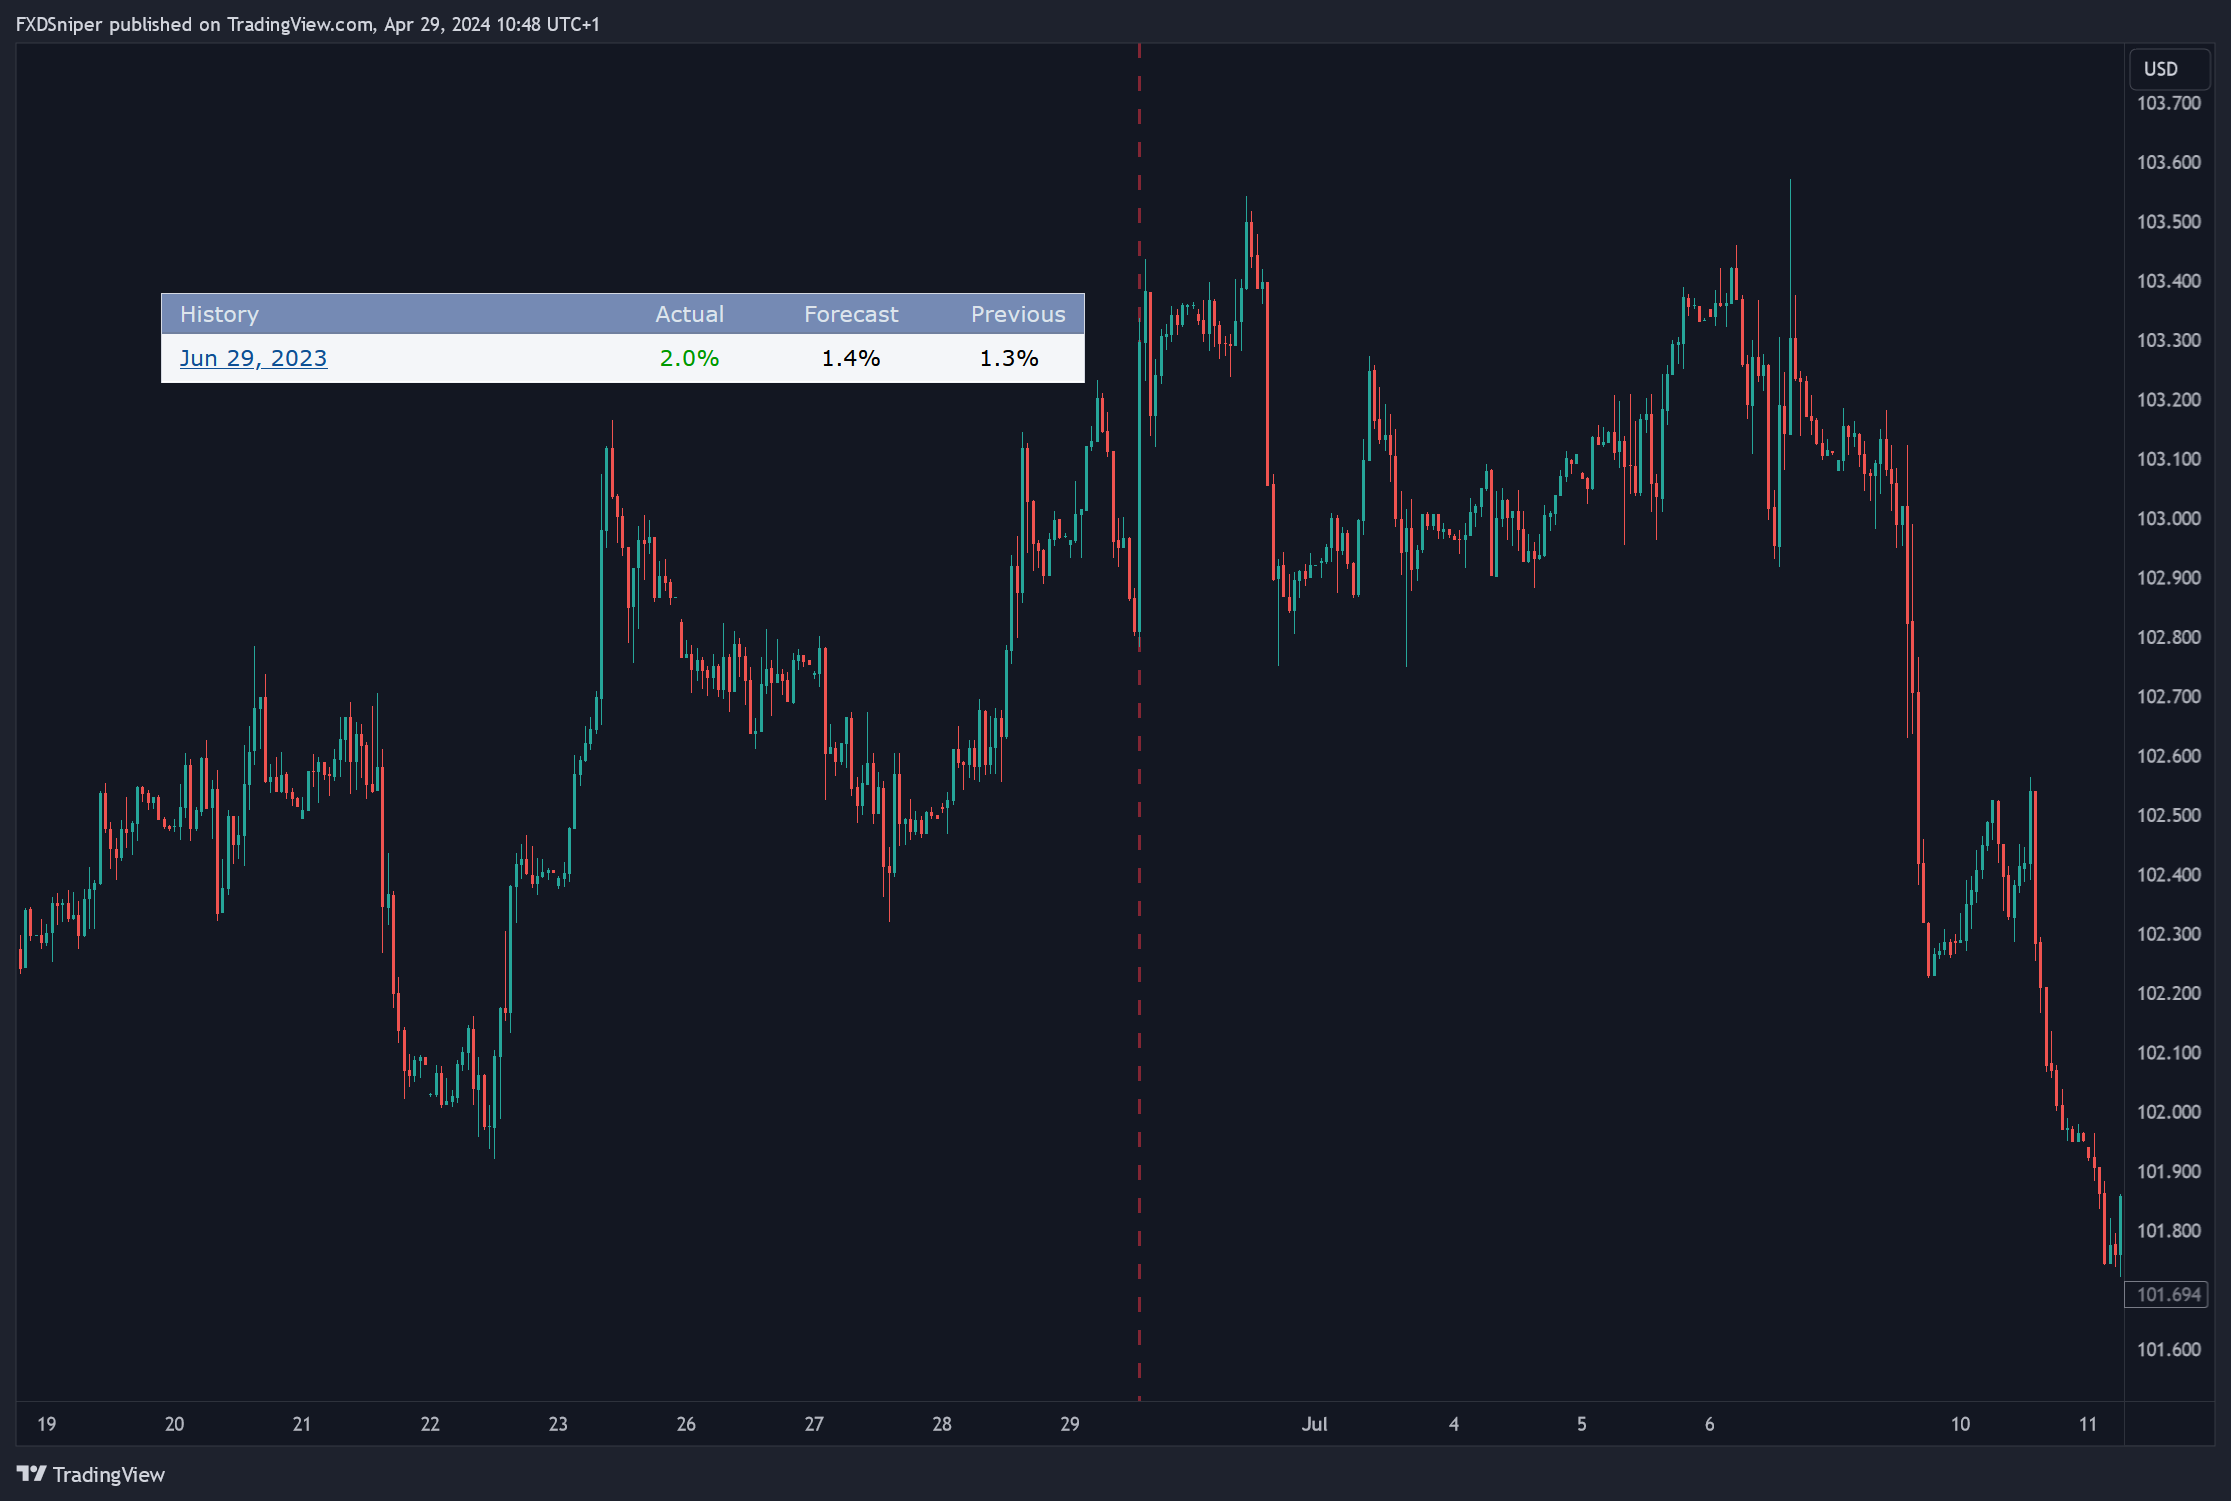
Here are some DXY examples:
The key things to note for CPI are:
- The better the numbers come out, the higher DXY will go, better the numbers also indicate a continuation in the days after (vice versa if the numbers are much worse).
- The closer the numbers are to the forecast the lower the volatility and potentially a reversal in the next few days.
I’m not going to explain what other pairs will do, the concept is pretty much the same as mentioned in the NFP example, whatever the DXY does the rest follows.
As for gold, it will do the opposite of what DXY does. Unlike during CPI where gold may do whatever it wants despite what the DXY is doing, during CPI gold usually tends to go the opposite way as DXY. The only difference is the initial candle during the news release as with gold you may notice a lot more liquidity sweeps during the first 1 minute candle of the release.
GDP
Again, there are different types of GDP news. Advanced GDP quarterly, Prelim GDP quarterly and Final GDP. There’s not really much difference in behavior between all of them so I’ll just explain GDP in general. Also CAD and GBP are the only major currencies that release monthly GDP numbers, all other currencies release them quarterly.
GDP is usually one of those less volatile news events, unless the results come out way more unexpected then they have been forecasted. That’s why I won’t be explaining the charts for this news as there’s just nothing to show, it’s boring. I just wanna show you the charts so you can see there is nothing to worry about if you see a red GDP folder on forexfactory.
If the news is green, the initial GDP candle will go up, if the news is red, the initial GDP candle will go down. What happens after just depends on what the price wants to do but it will most likely maintain the original bias.
Same thing applies to all major currencies.
PMI
There are 5 different PMI news event in the US:
- Final Manufacturing PMI
- ISM Manufacturing PMI
These two are released first, usually on the 1st of each month unless there’s a holiday or it’s a weekend.
- ISM Services PMI
This is released alone, a few days after the previous ones.
- Flash Manufacturing PMI
- Flash Services PMI
And these ones are released last, during the second half of each month.
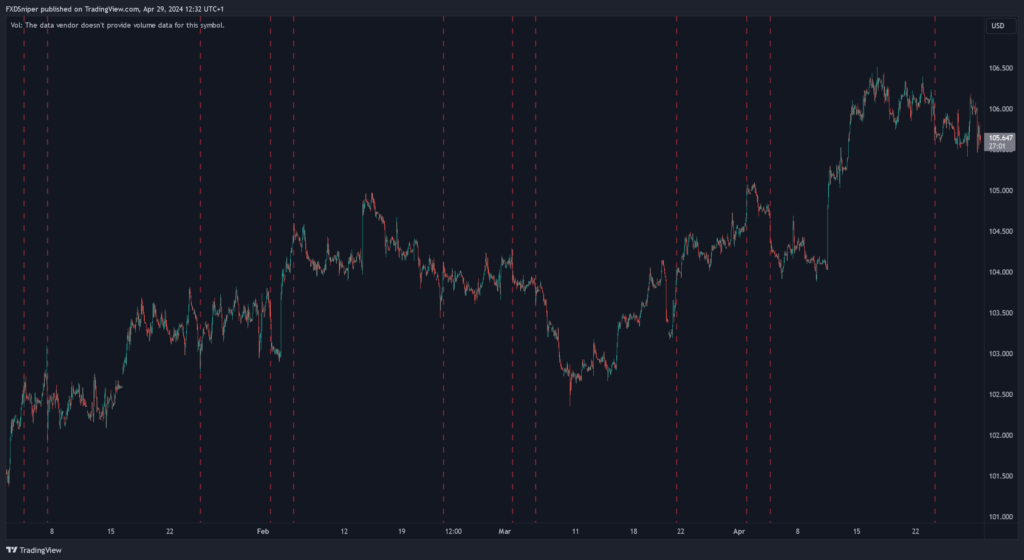
PMI usually behaves the same way CPI does. It has a strong push in one direction potentially followed by a reversal days after.
Most of the time the early month PMI news both tend to move in the same direction. So if the first PMI news of the month pushes the price higher, it is very likely the ISM Services PMI will also continue higher. The reversal tends to happen during the end of month PMI. But it also depends on the news numbers, green = up, red = down.
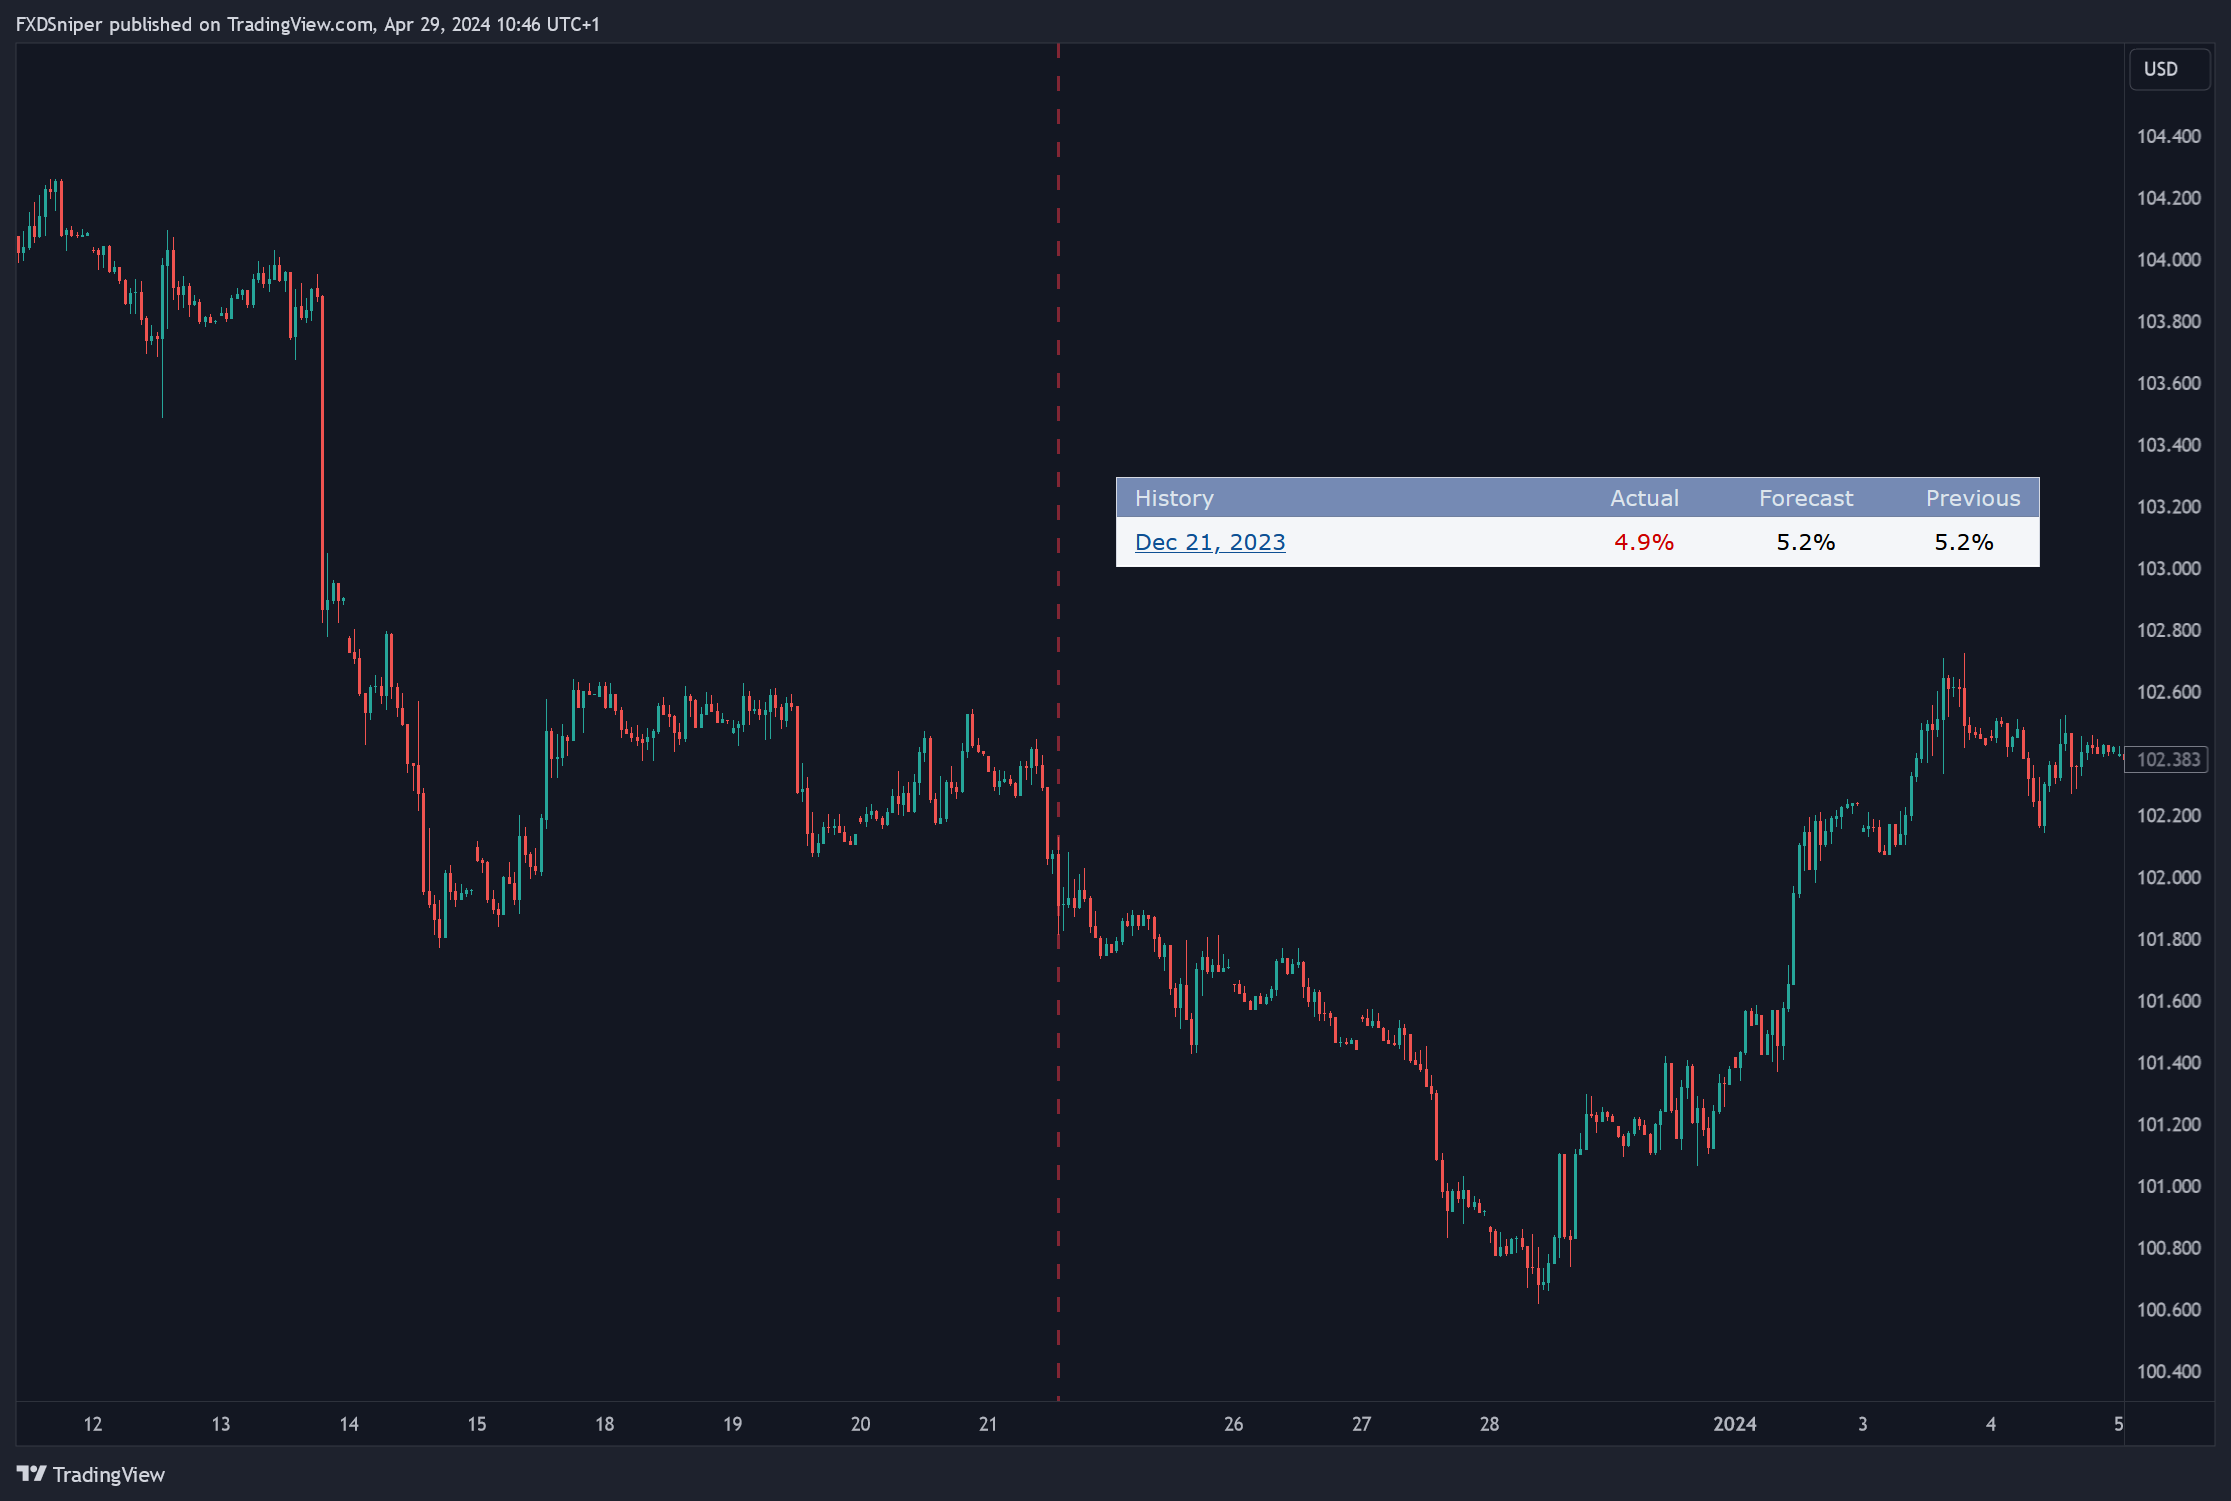
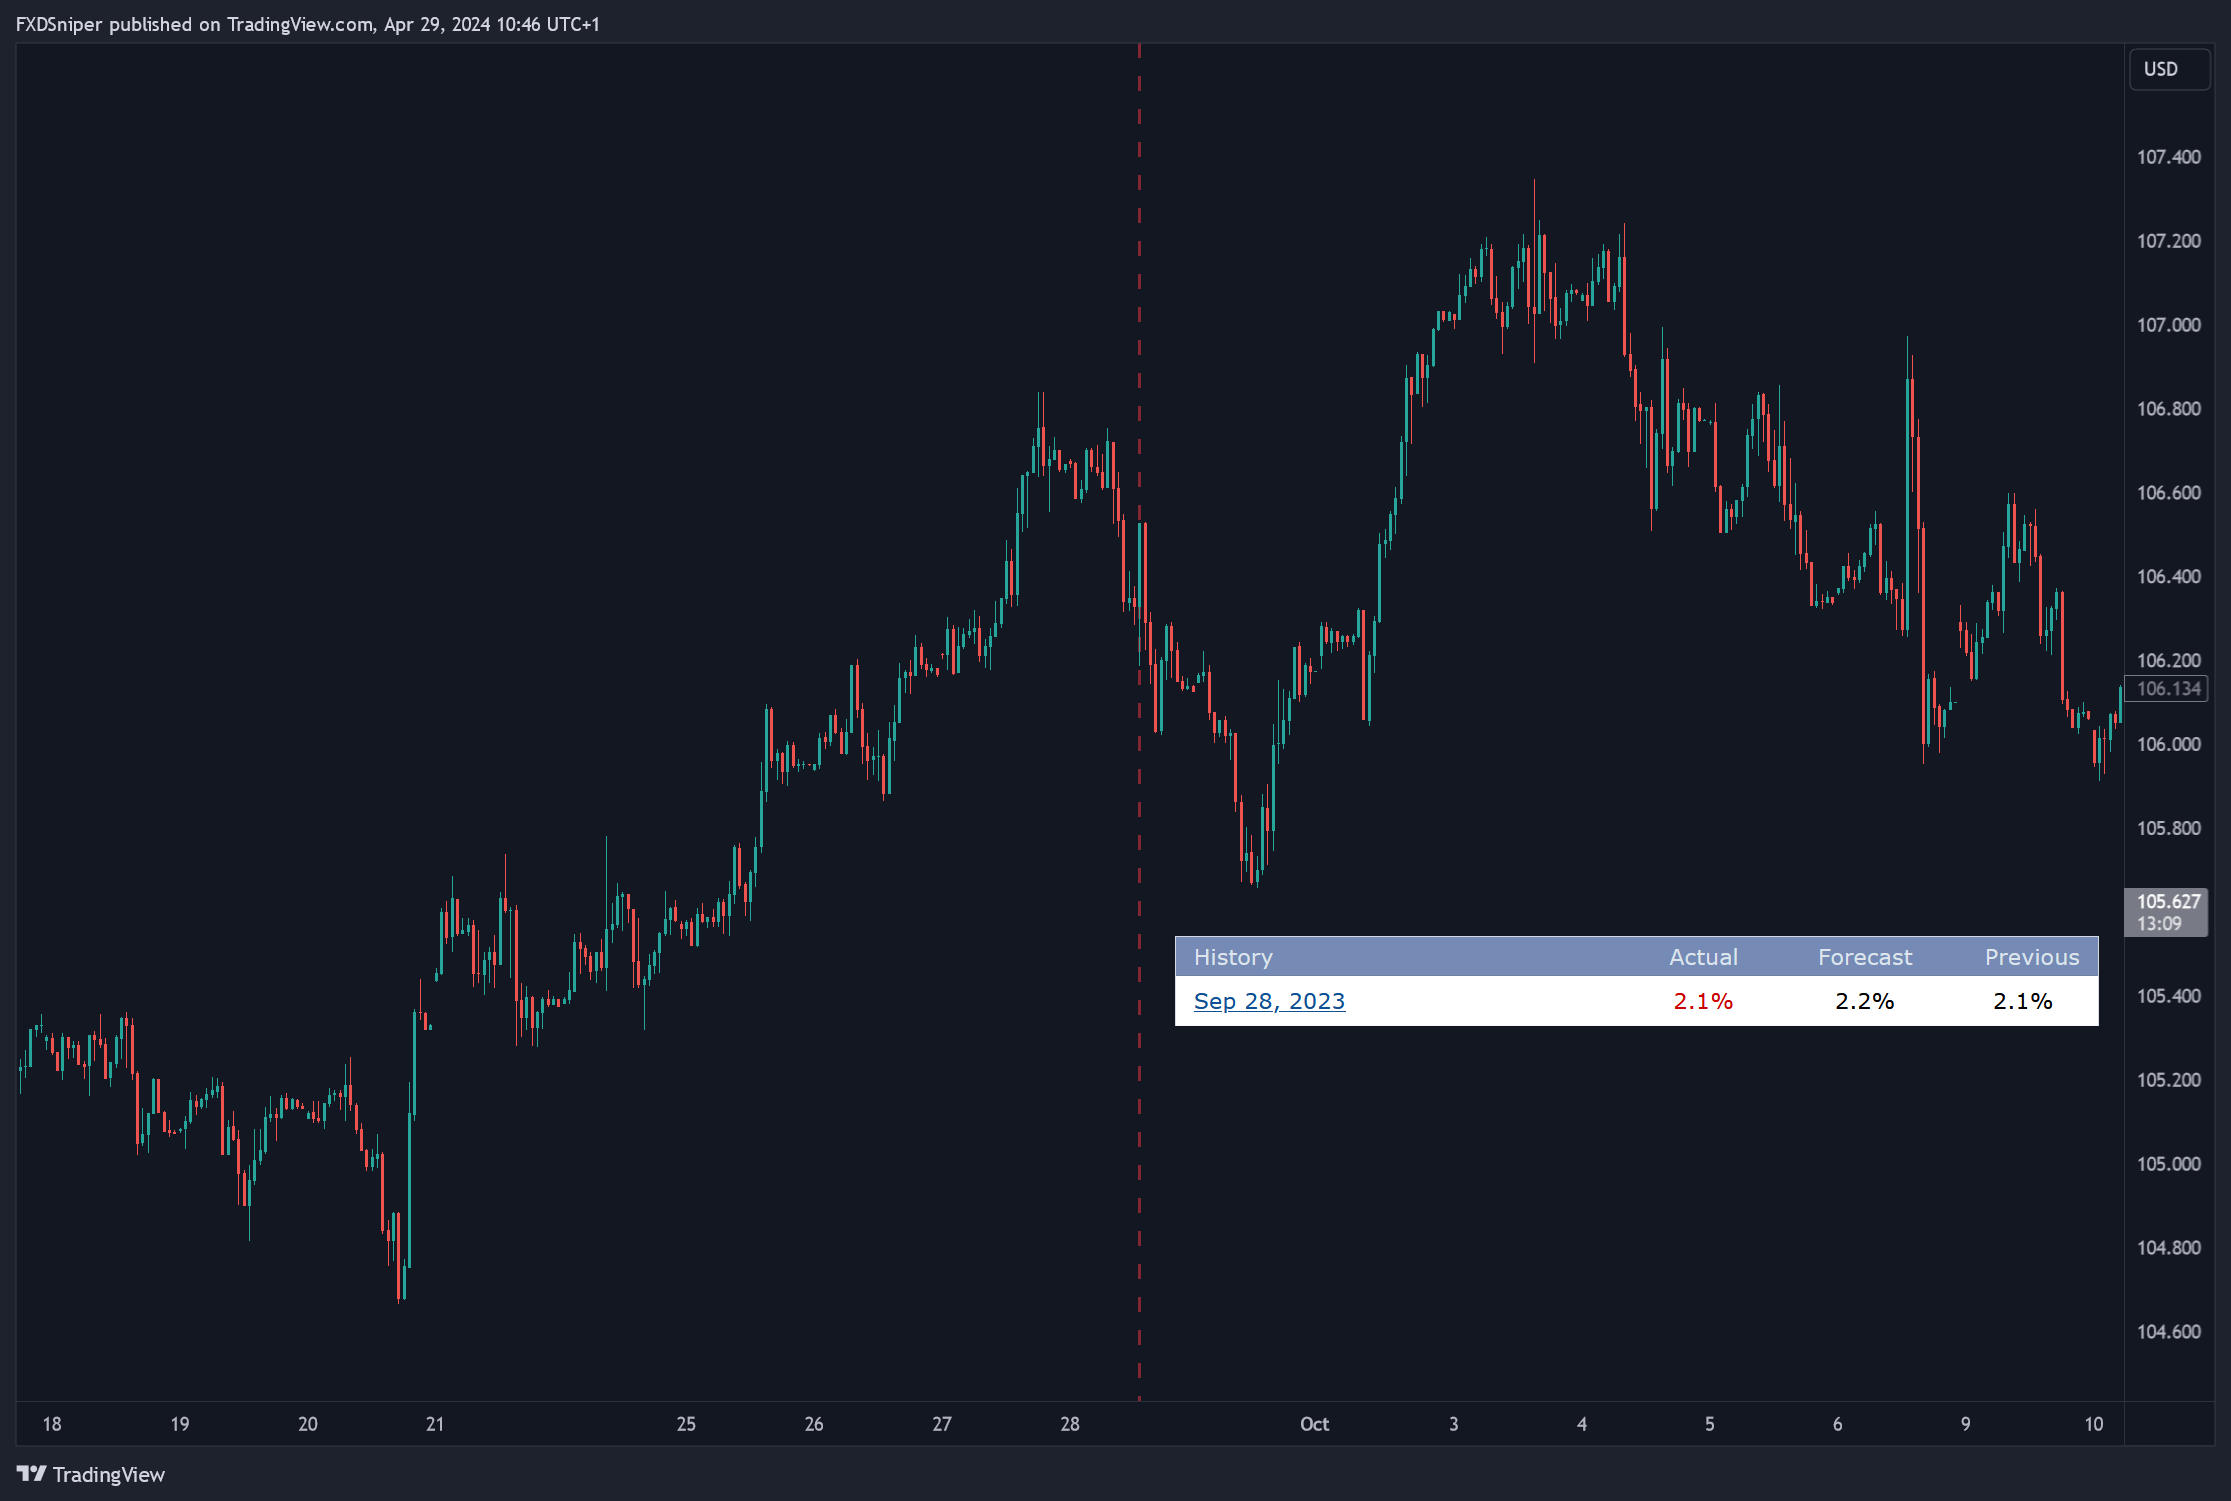
It would be too much charts to show you and describe each event closely, so this is what the last 4 months of PMI looked like:
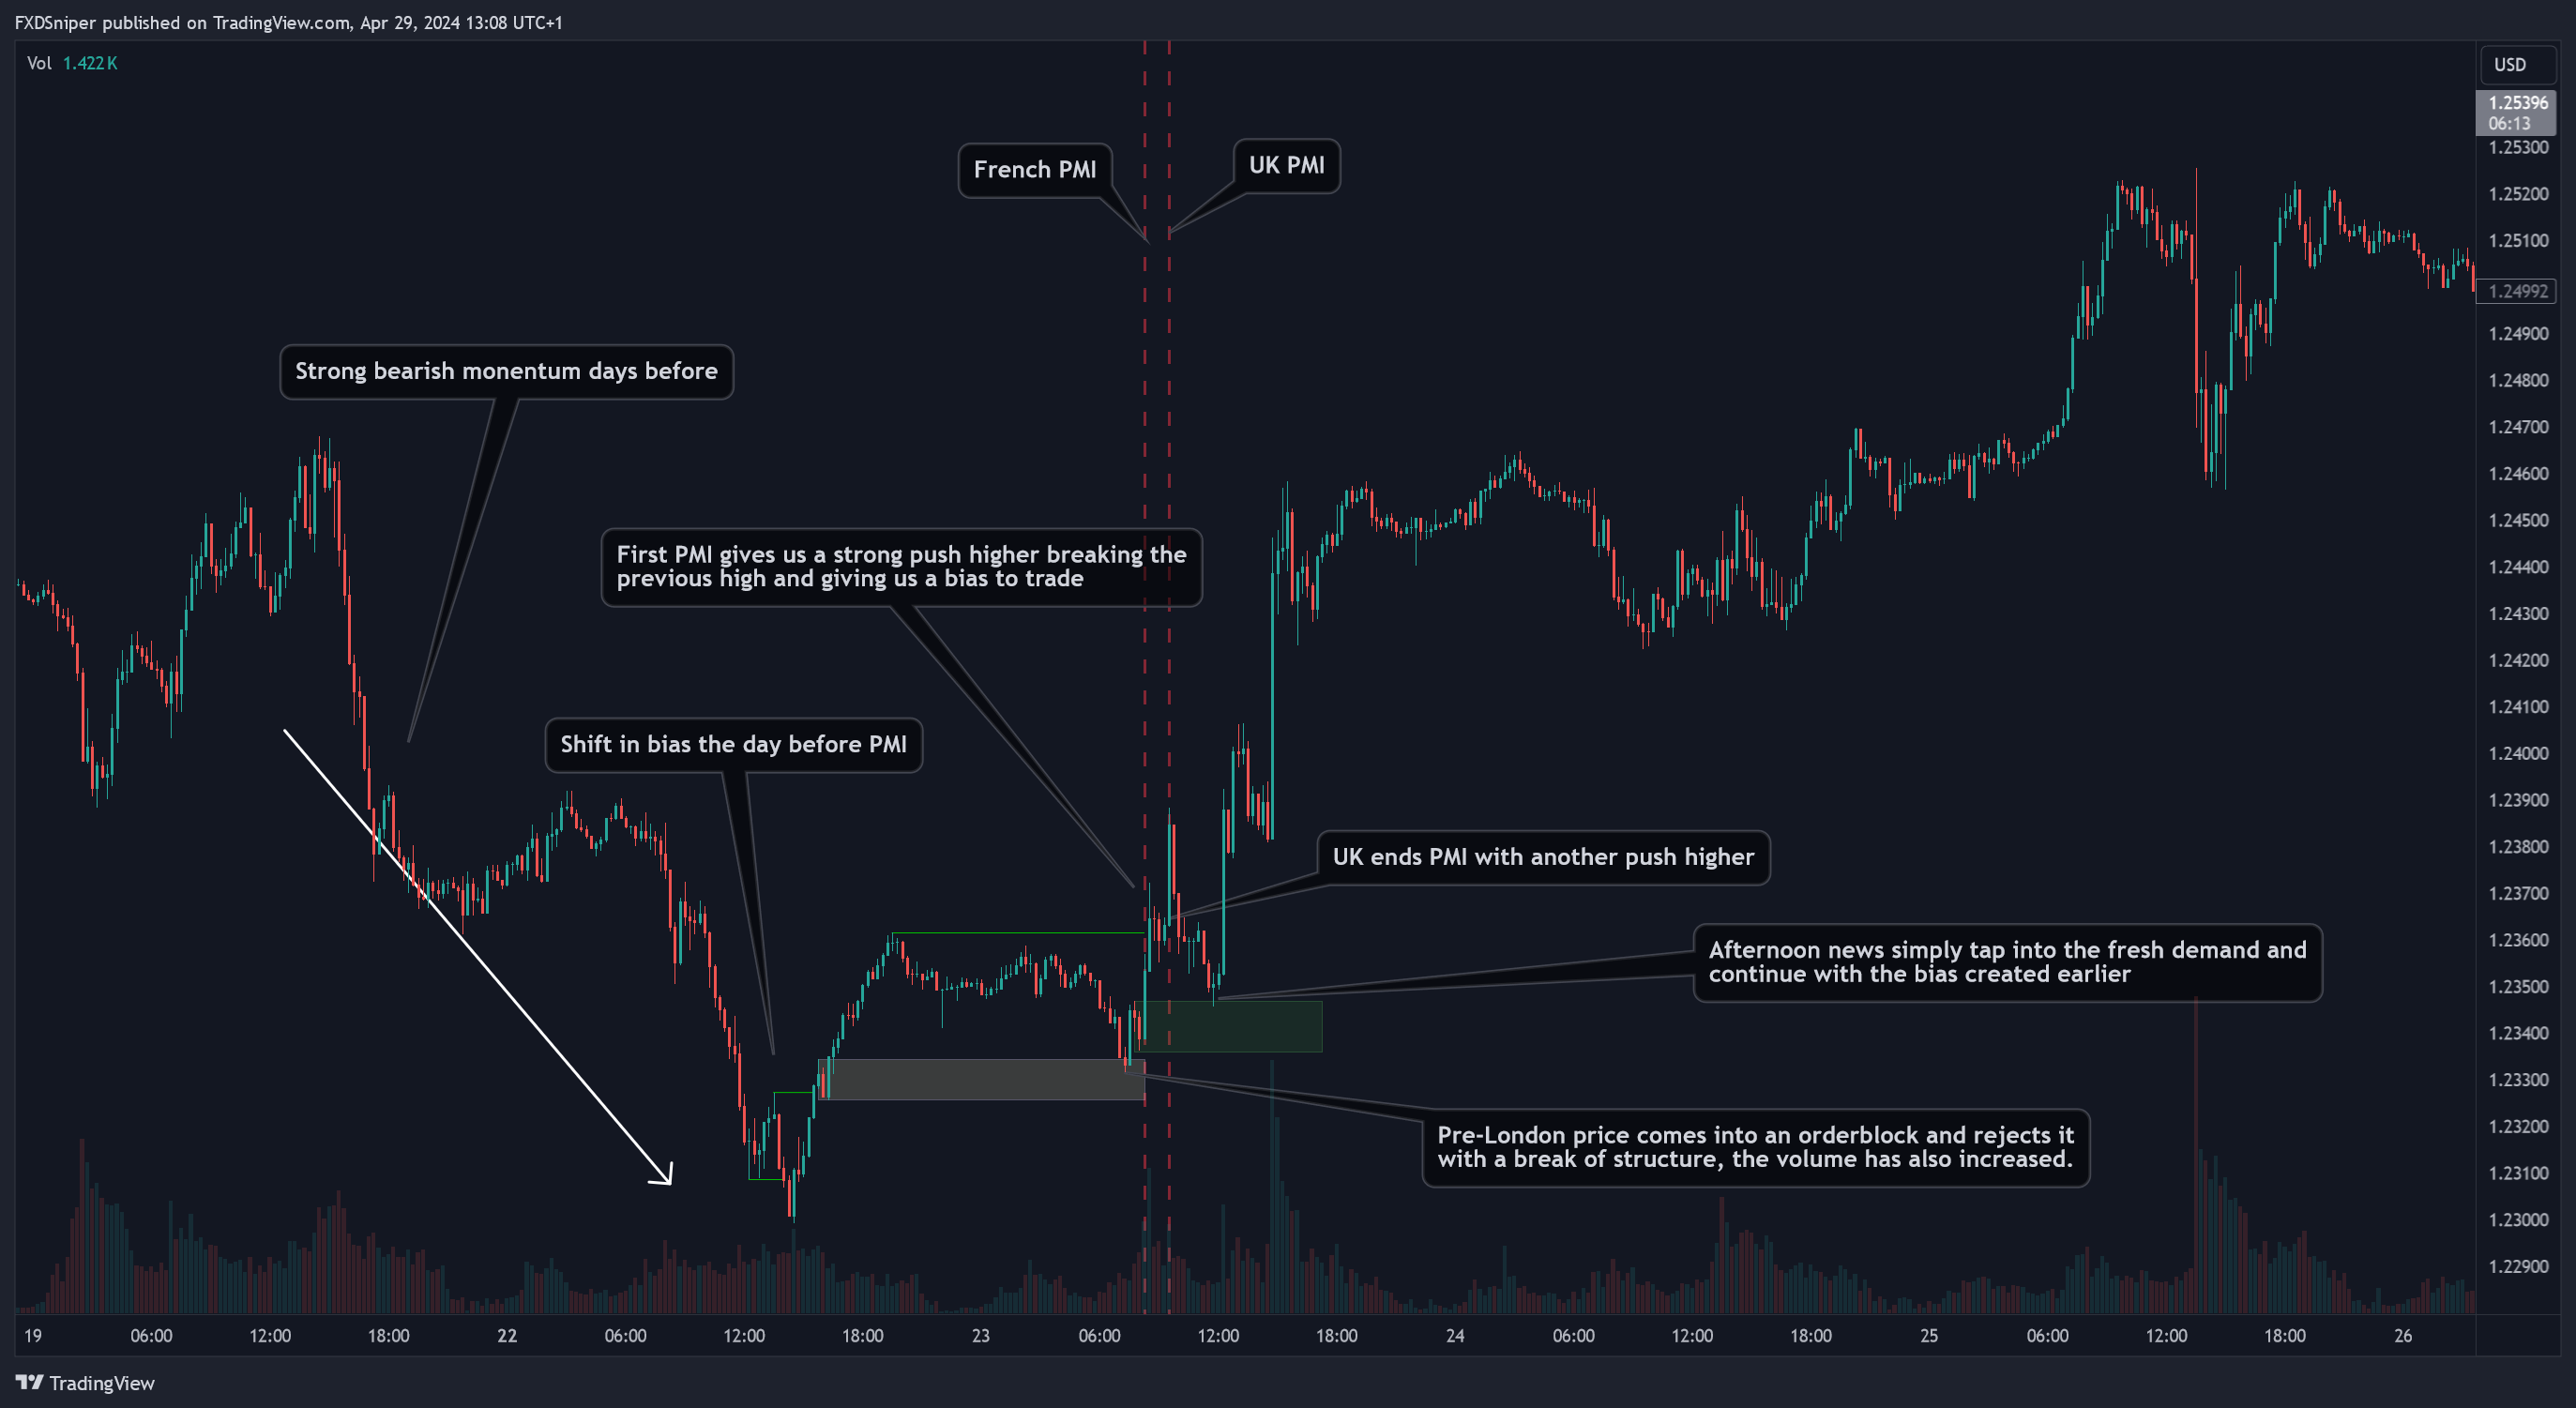
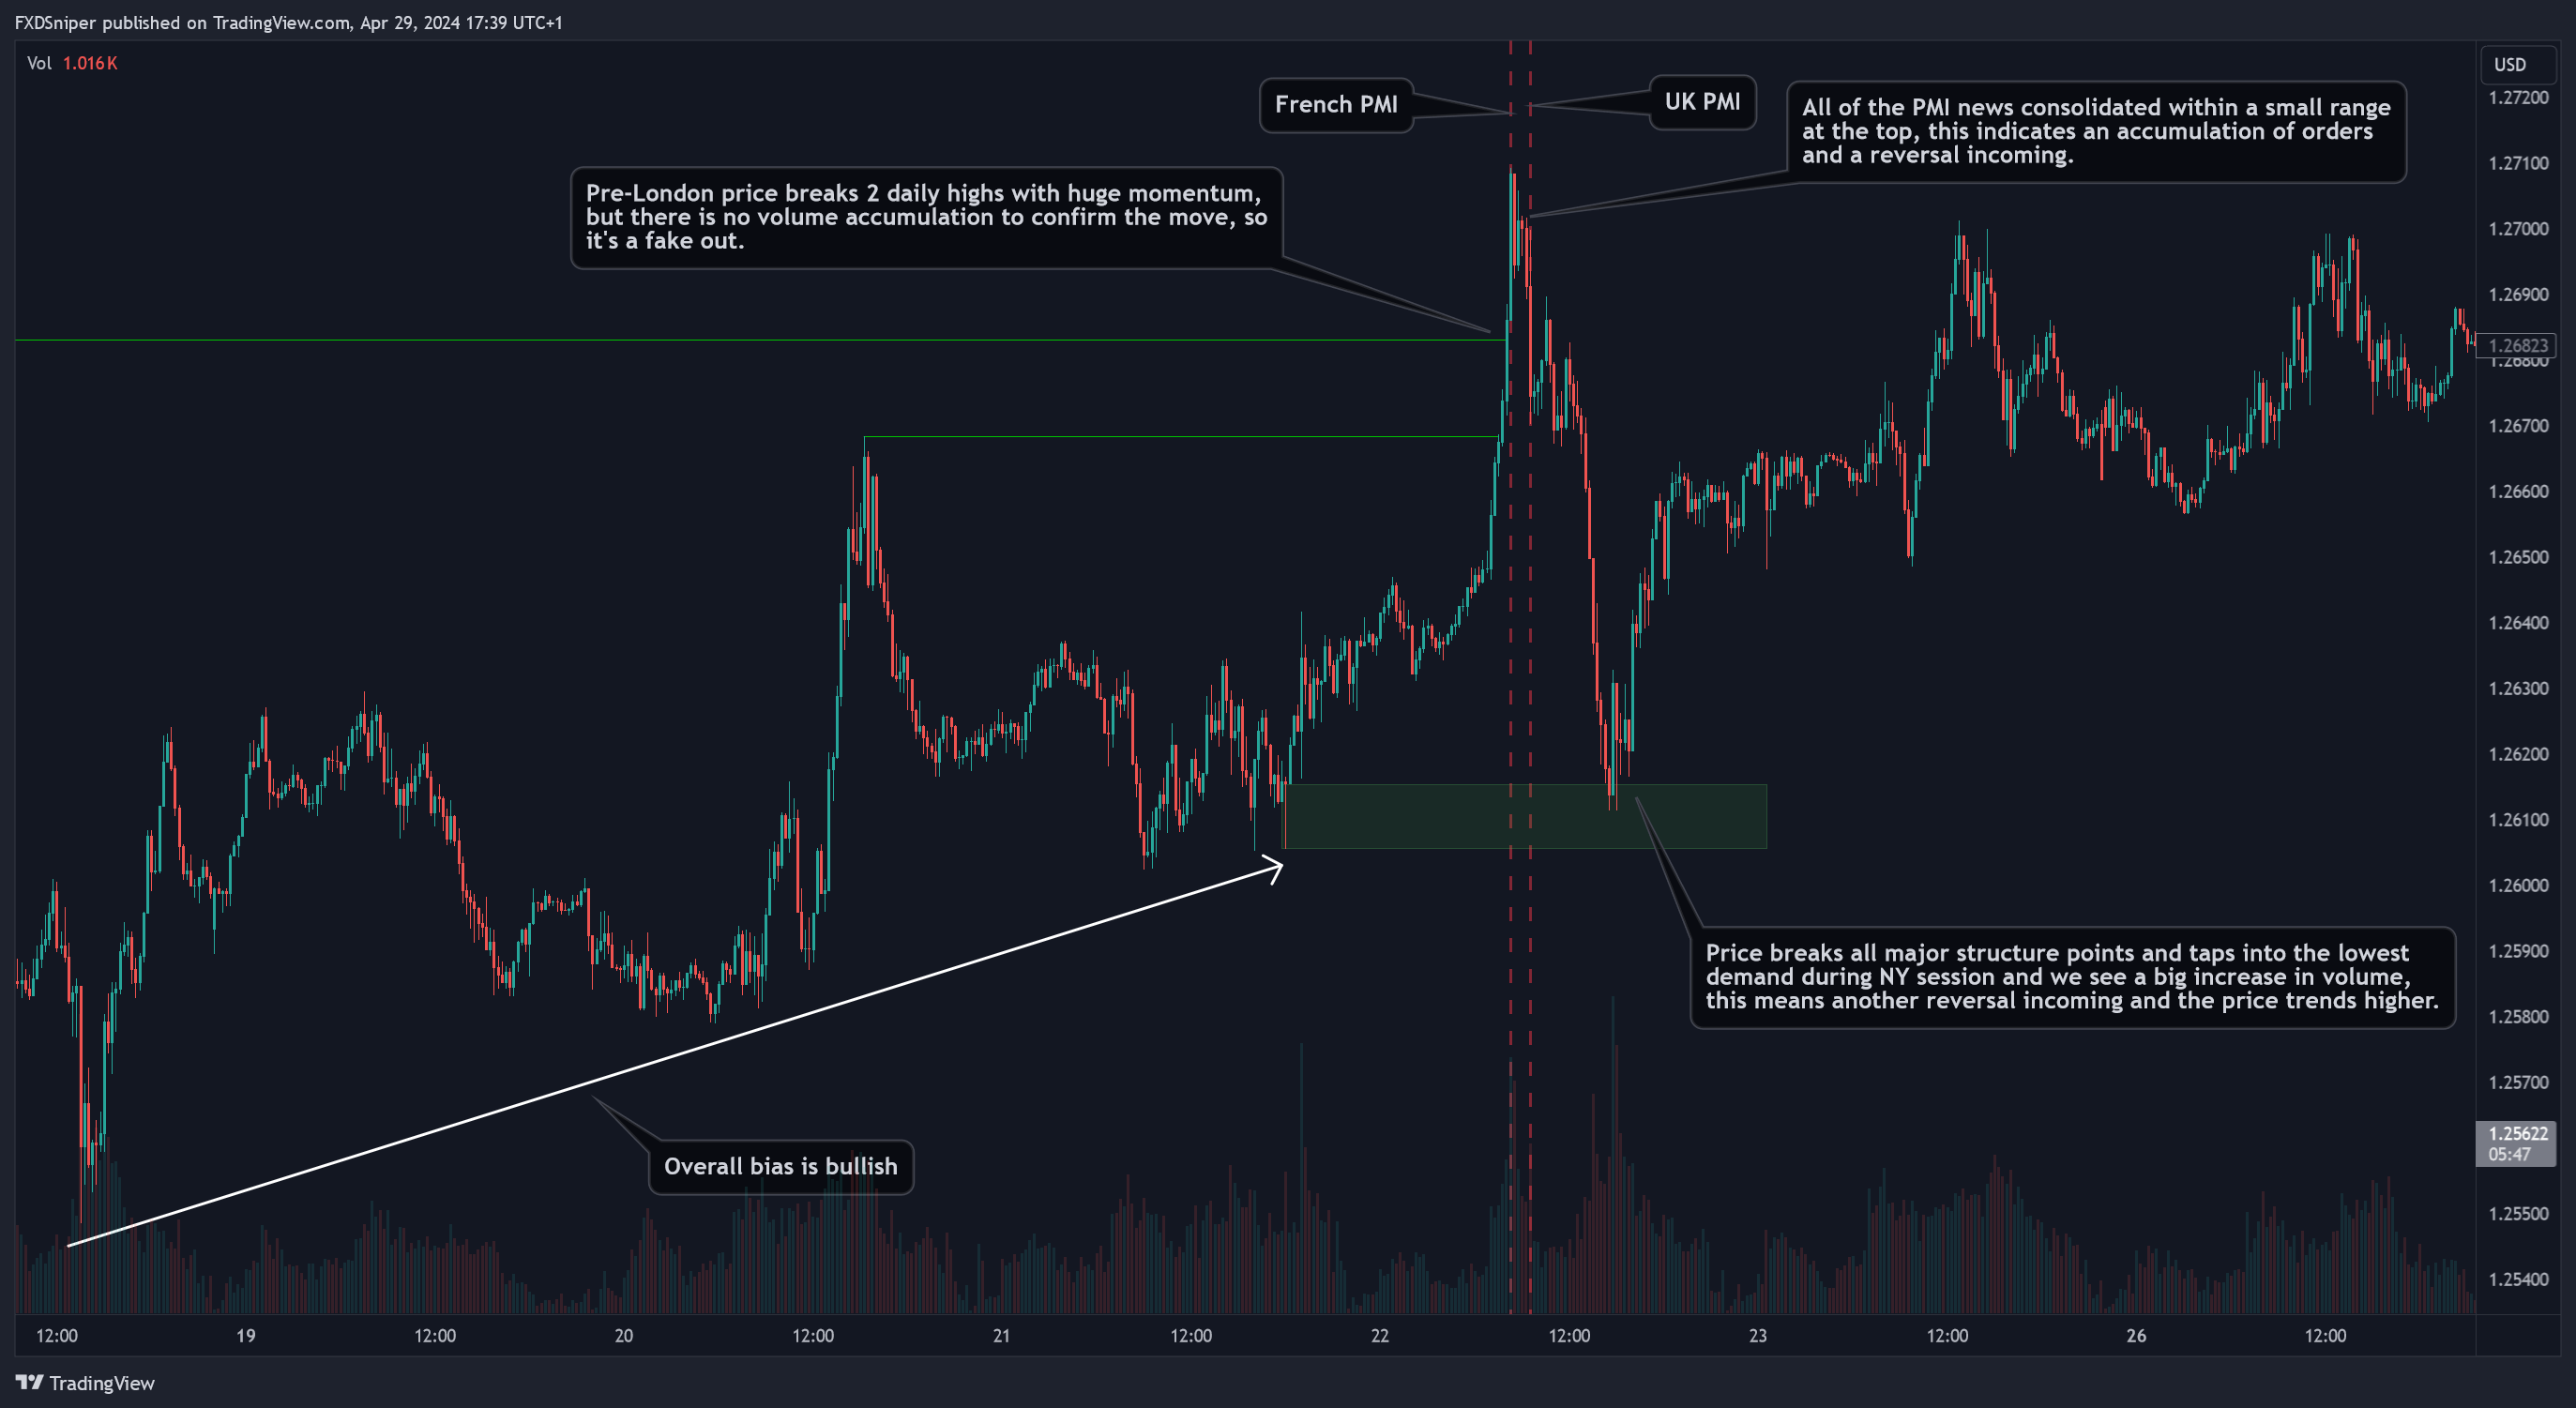
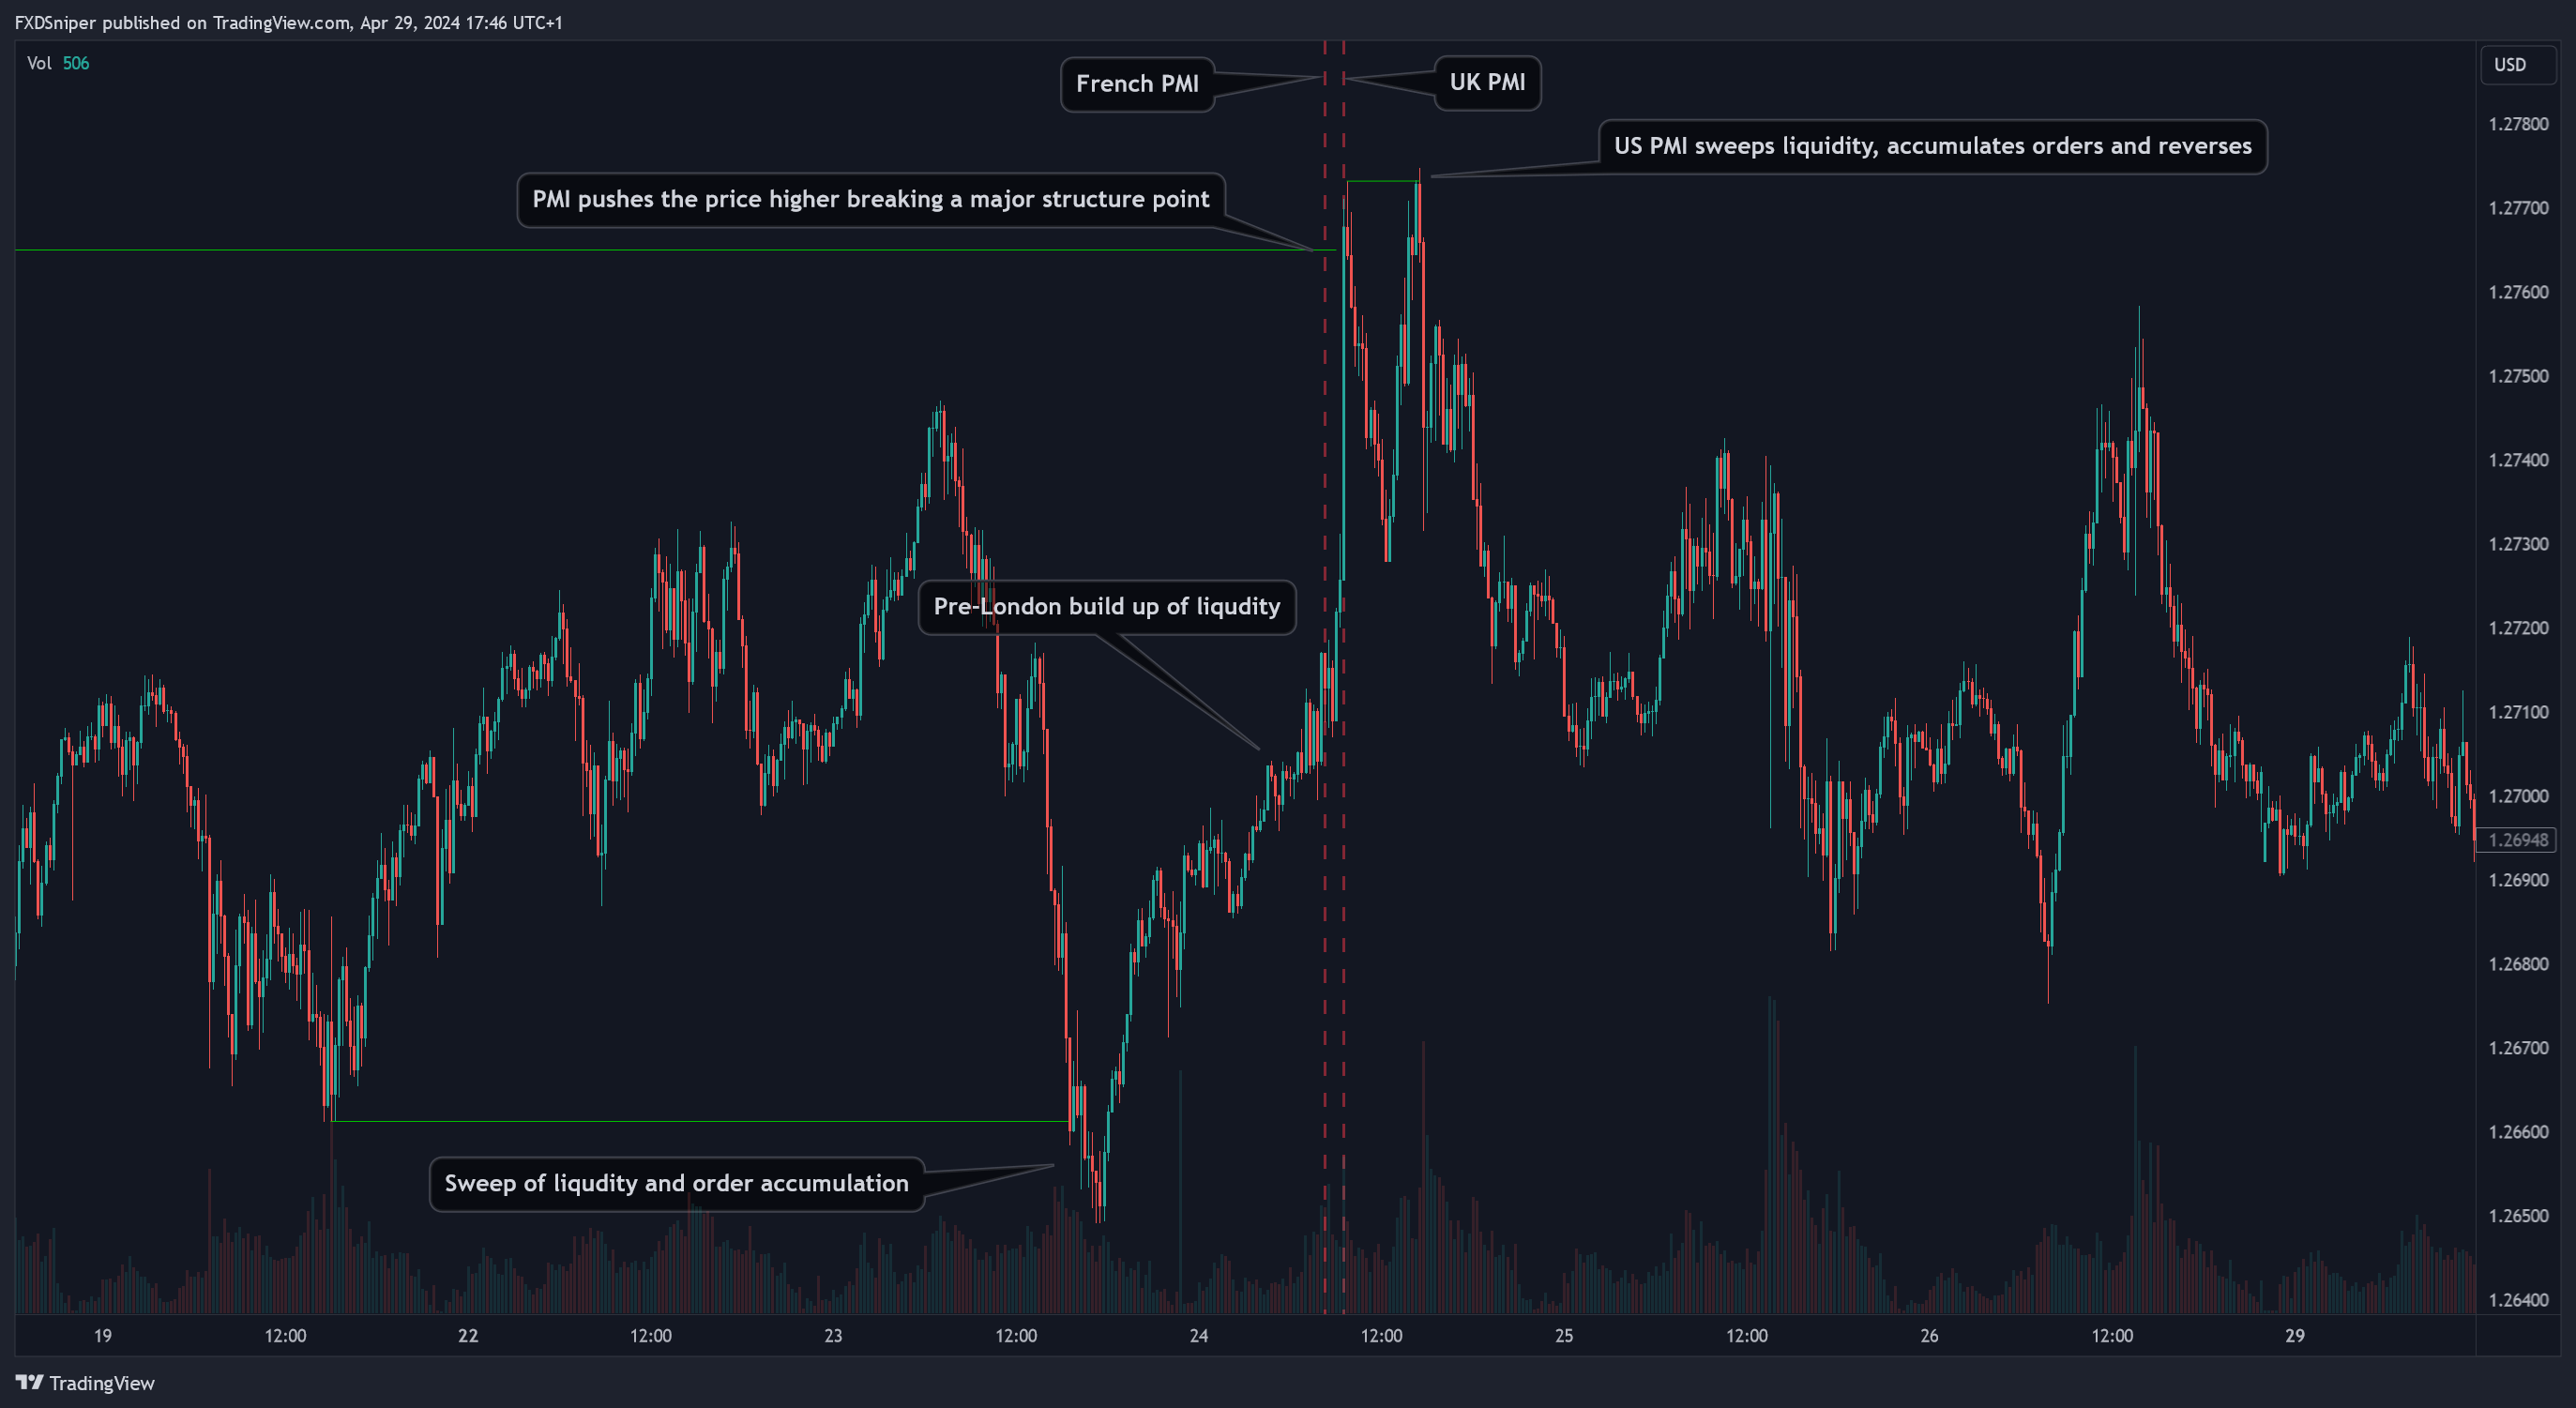
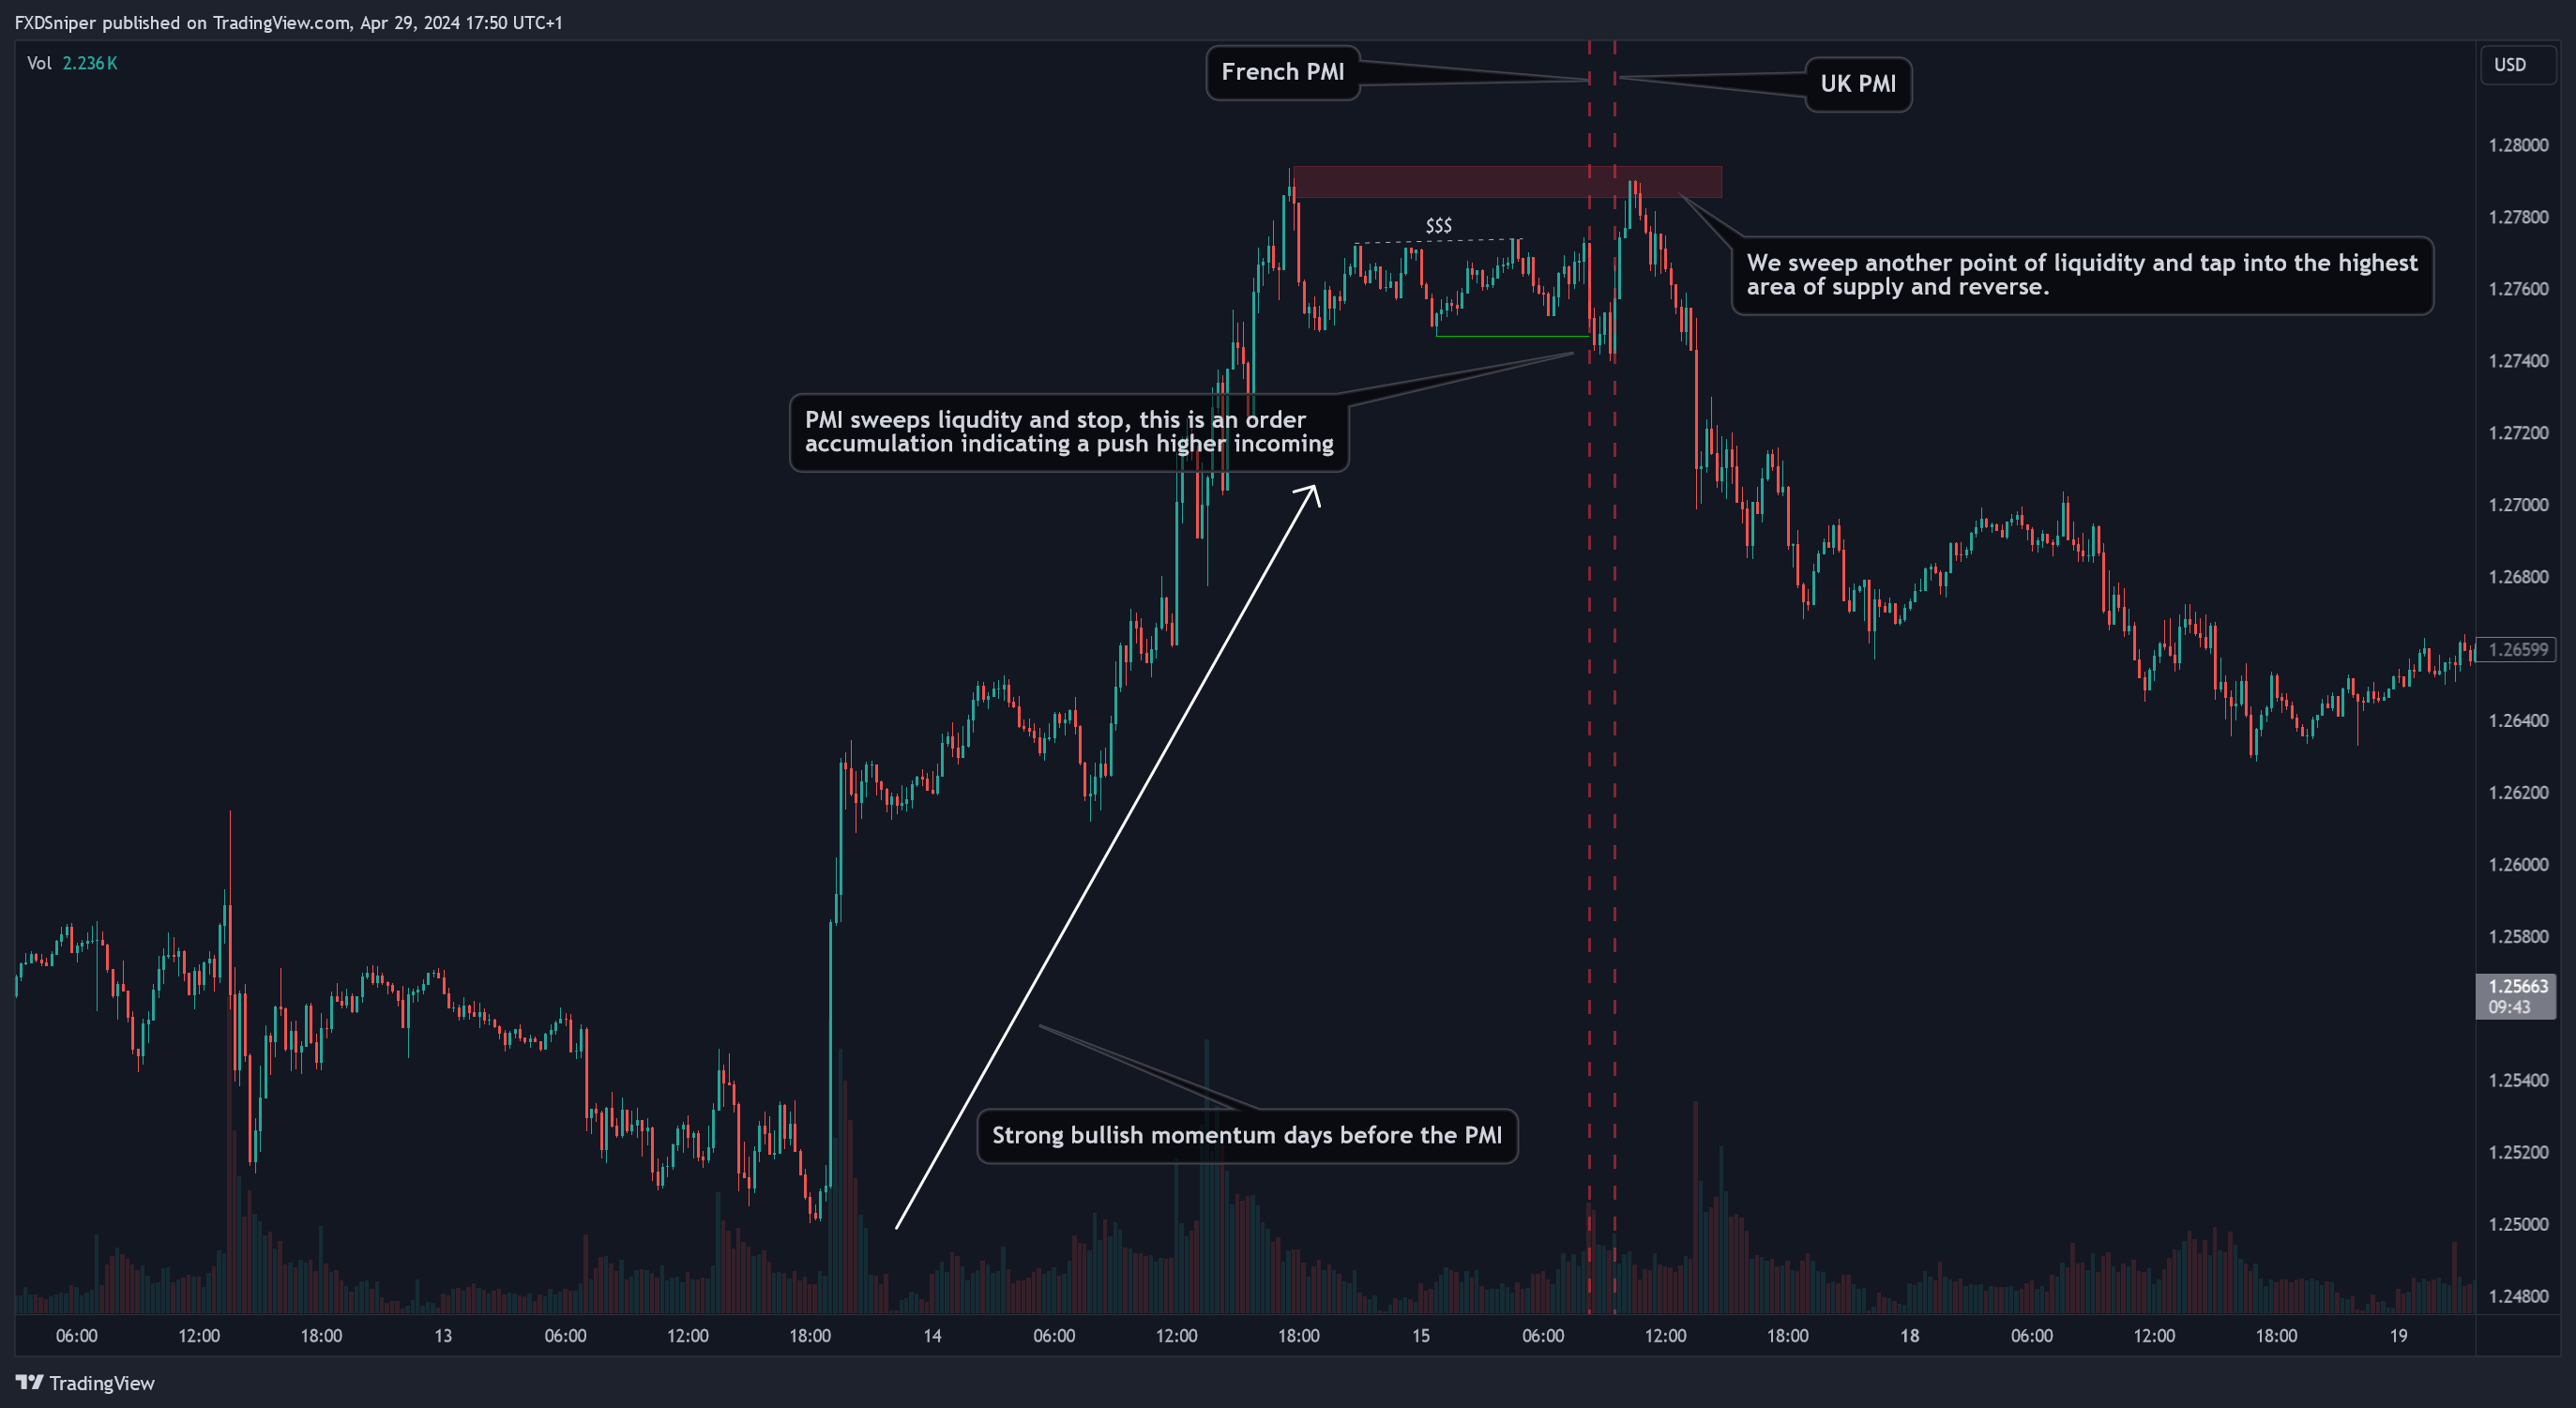
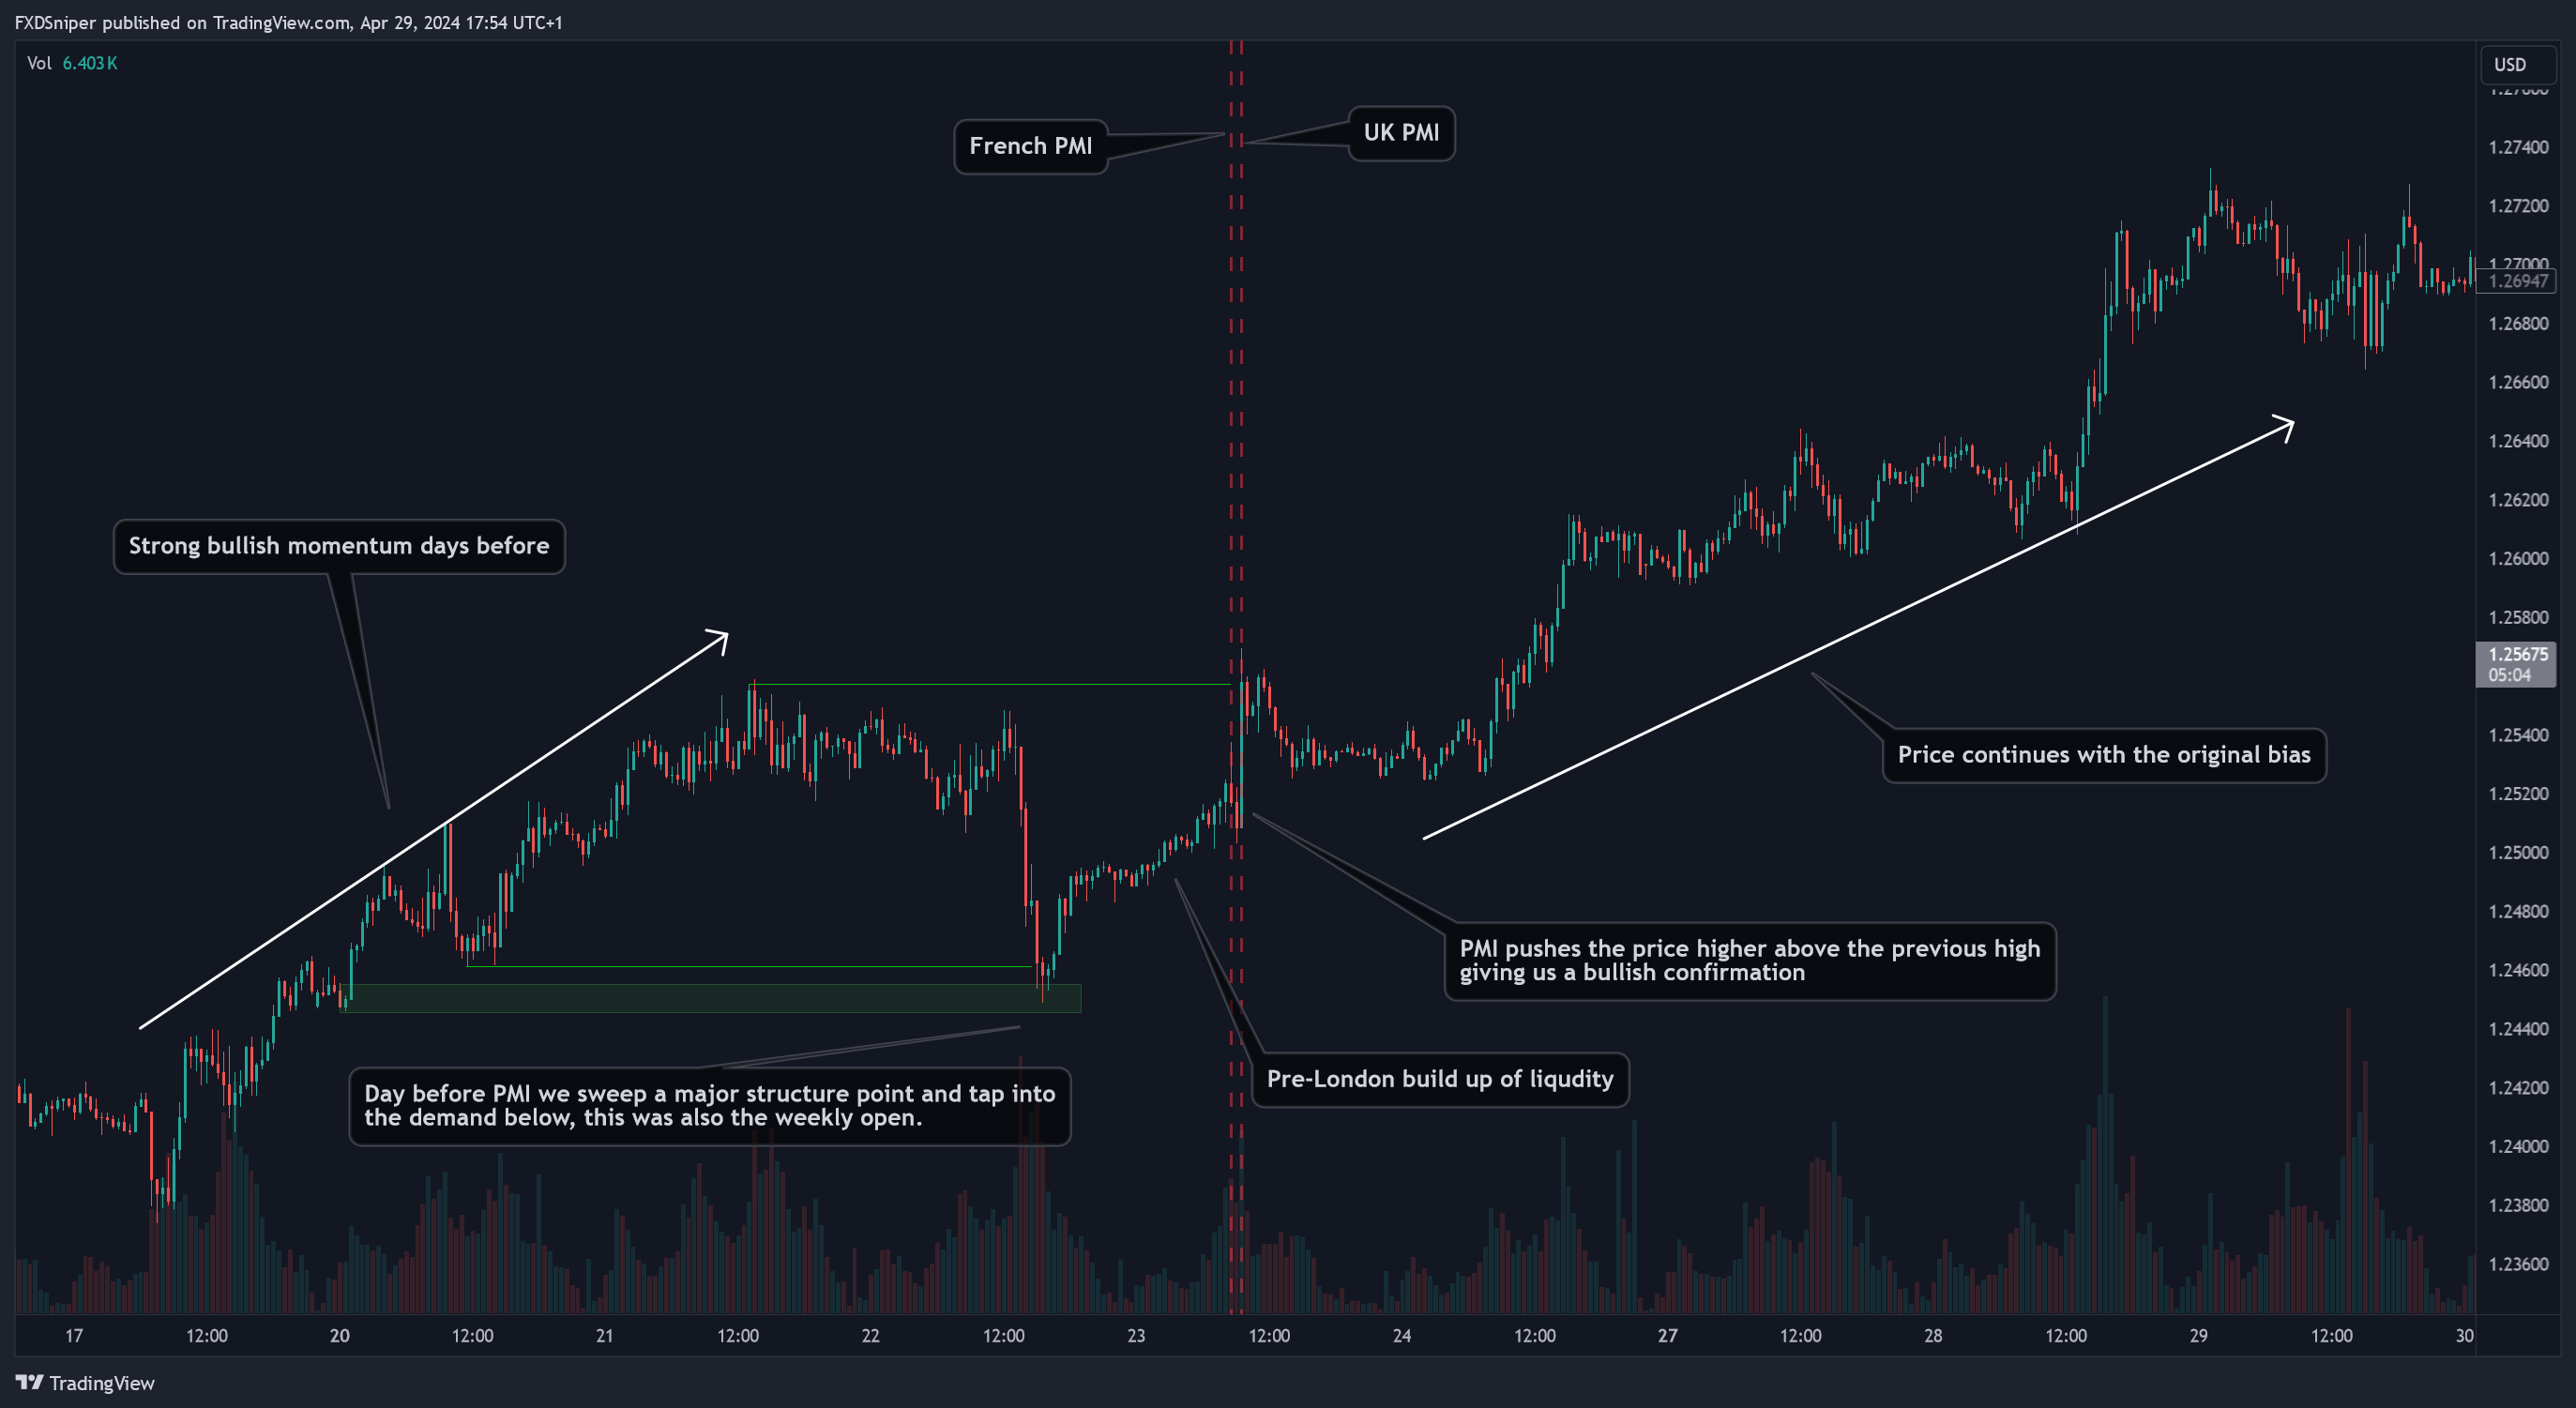
I will show you detailed charts for the European PMI as they are all released on the same day. Europe has only 2 major PMI events: Flash Manufacturing PMI & Flash Services PMI. They are released during early London session in order starting from French – German – Euro – UK, all are released 15-30 minutes apart.
Trading the European PMI is much easier in my opinion as the charts before and after look much cleaner and clearer to read unlike the US PMI. Usually you can tell what the news will do before the London session opens. Even if you didn’t get into a trade pre-london the first set of news will show you the direction price wants to go.
Also note that the same day the European PMI is released, US Flash Manufacturing & Services PMI is also released on the same day. So depending on what the previous news did, the second one during NY session will usually do the opposite.
Let me show you some GBP/USD examples:
I didn’t show the news numbers for this one as they would take out too much space. They don’t really matter anyway as the news are coming from multiple countries at different times. Price will simply do what it wanted to do since before the news. The news are just give it a boost.
Unemployment Claims/Rates
When it comes to unemployment news, we have the unemployment rates and claims. In the US, unemployment rates are always released with NFP so I won’t be explaining it here. I’ll focus on the unemployment claims which are released every week for the USD.
As for other major currencies, unemployment rates and claims are released once a month, both at the same time and their overall behavior is very similar across all of them so no need to explain each one separately.
Even though this news is market in red it’s not actually very volatile and won’t impact your trade as long as you’re on the right side. Price will simply continue with its original bias, you may get a little sweep of a recent structure but overall it doesn’t affect the main bias.
This is what happens with DXY during the weekly unemployment claims:
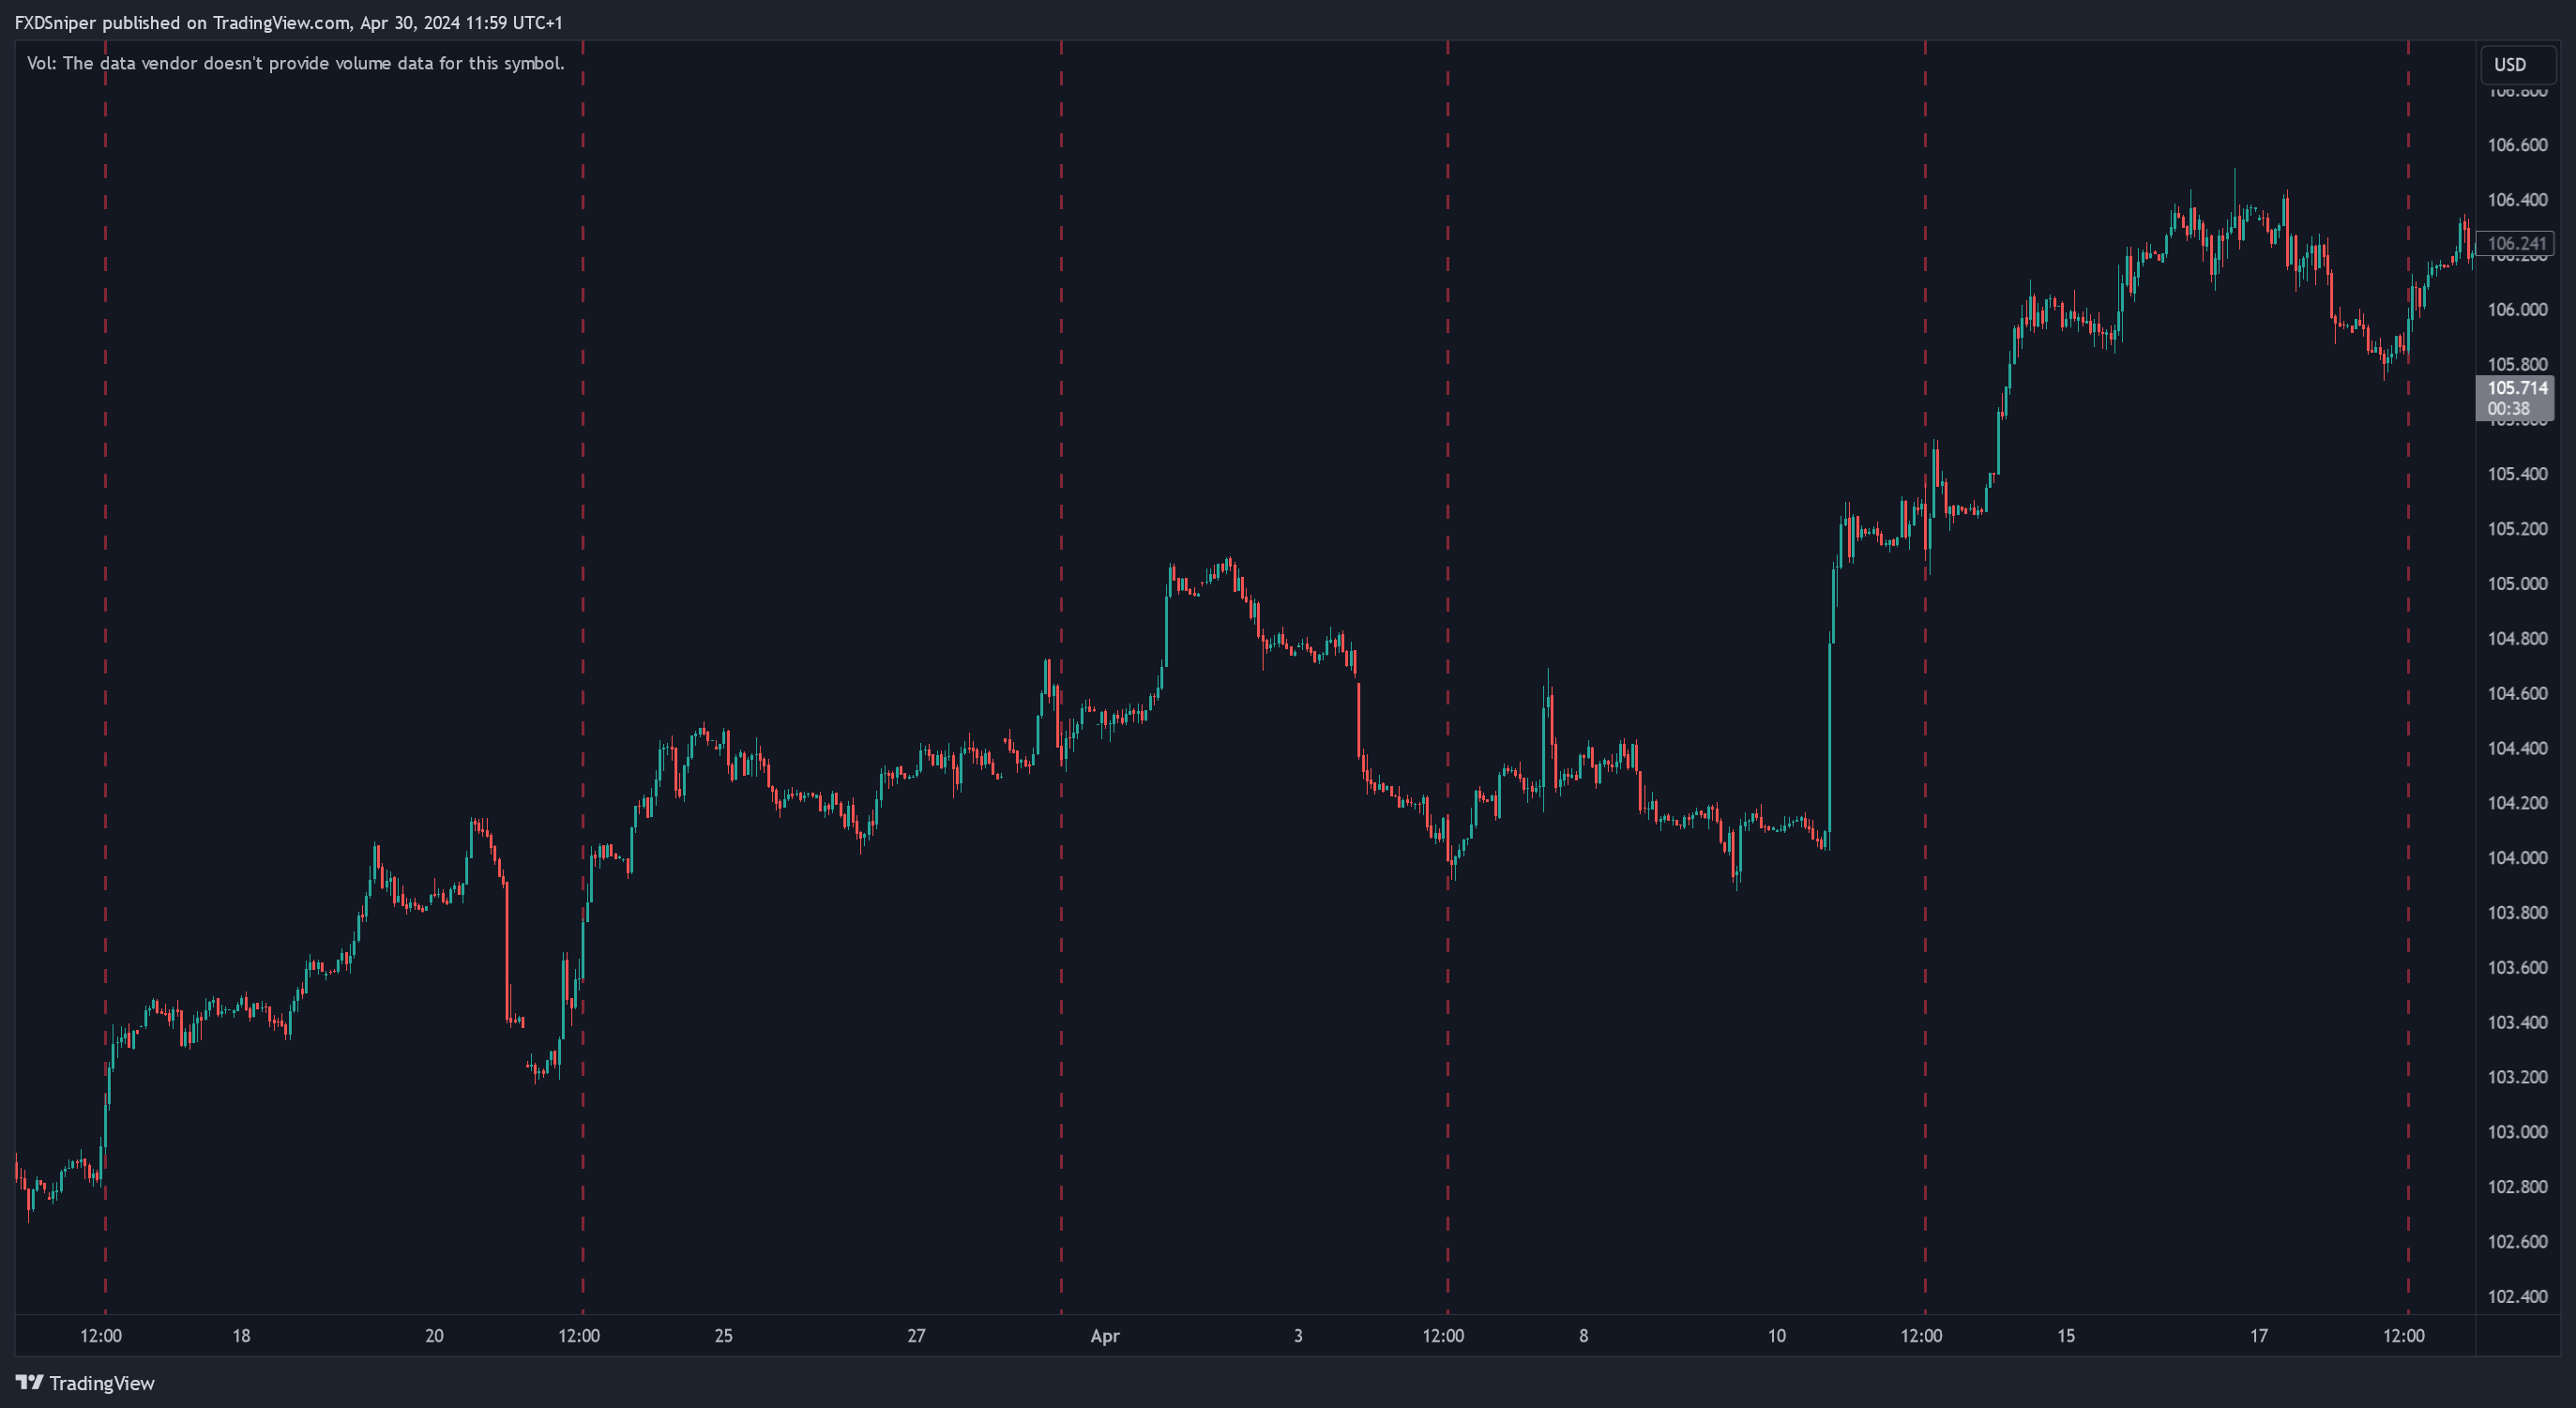
Again I didn’t explain every detail in this chart as there’s just nothing going on.
As for gold, it’s pretty much unaffected so there’s nothing for you to worry about:
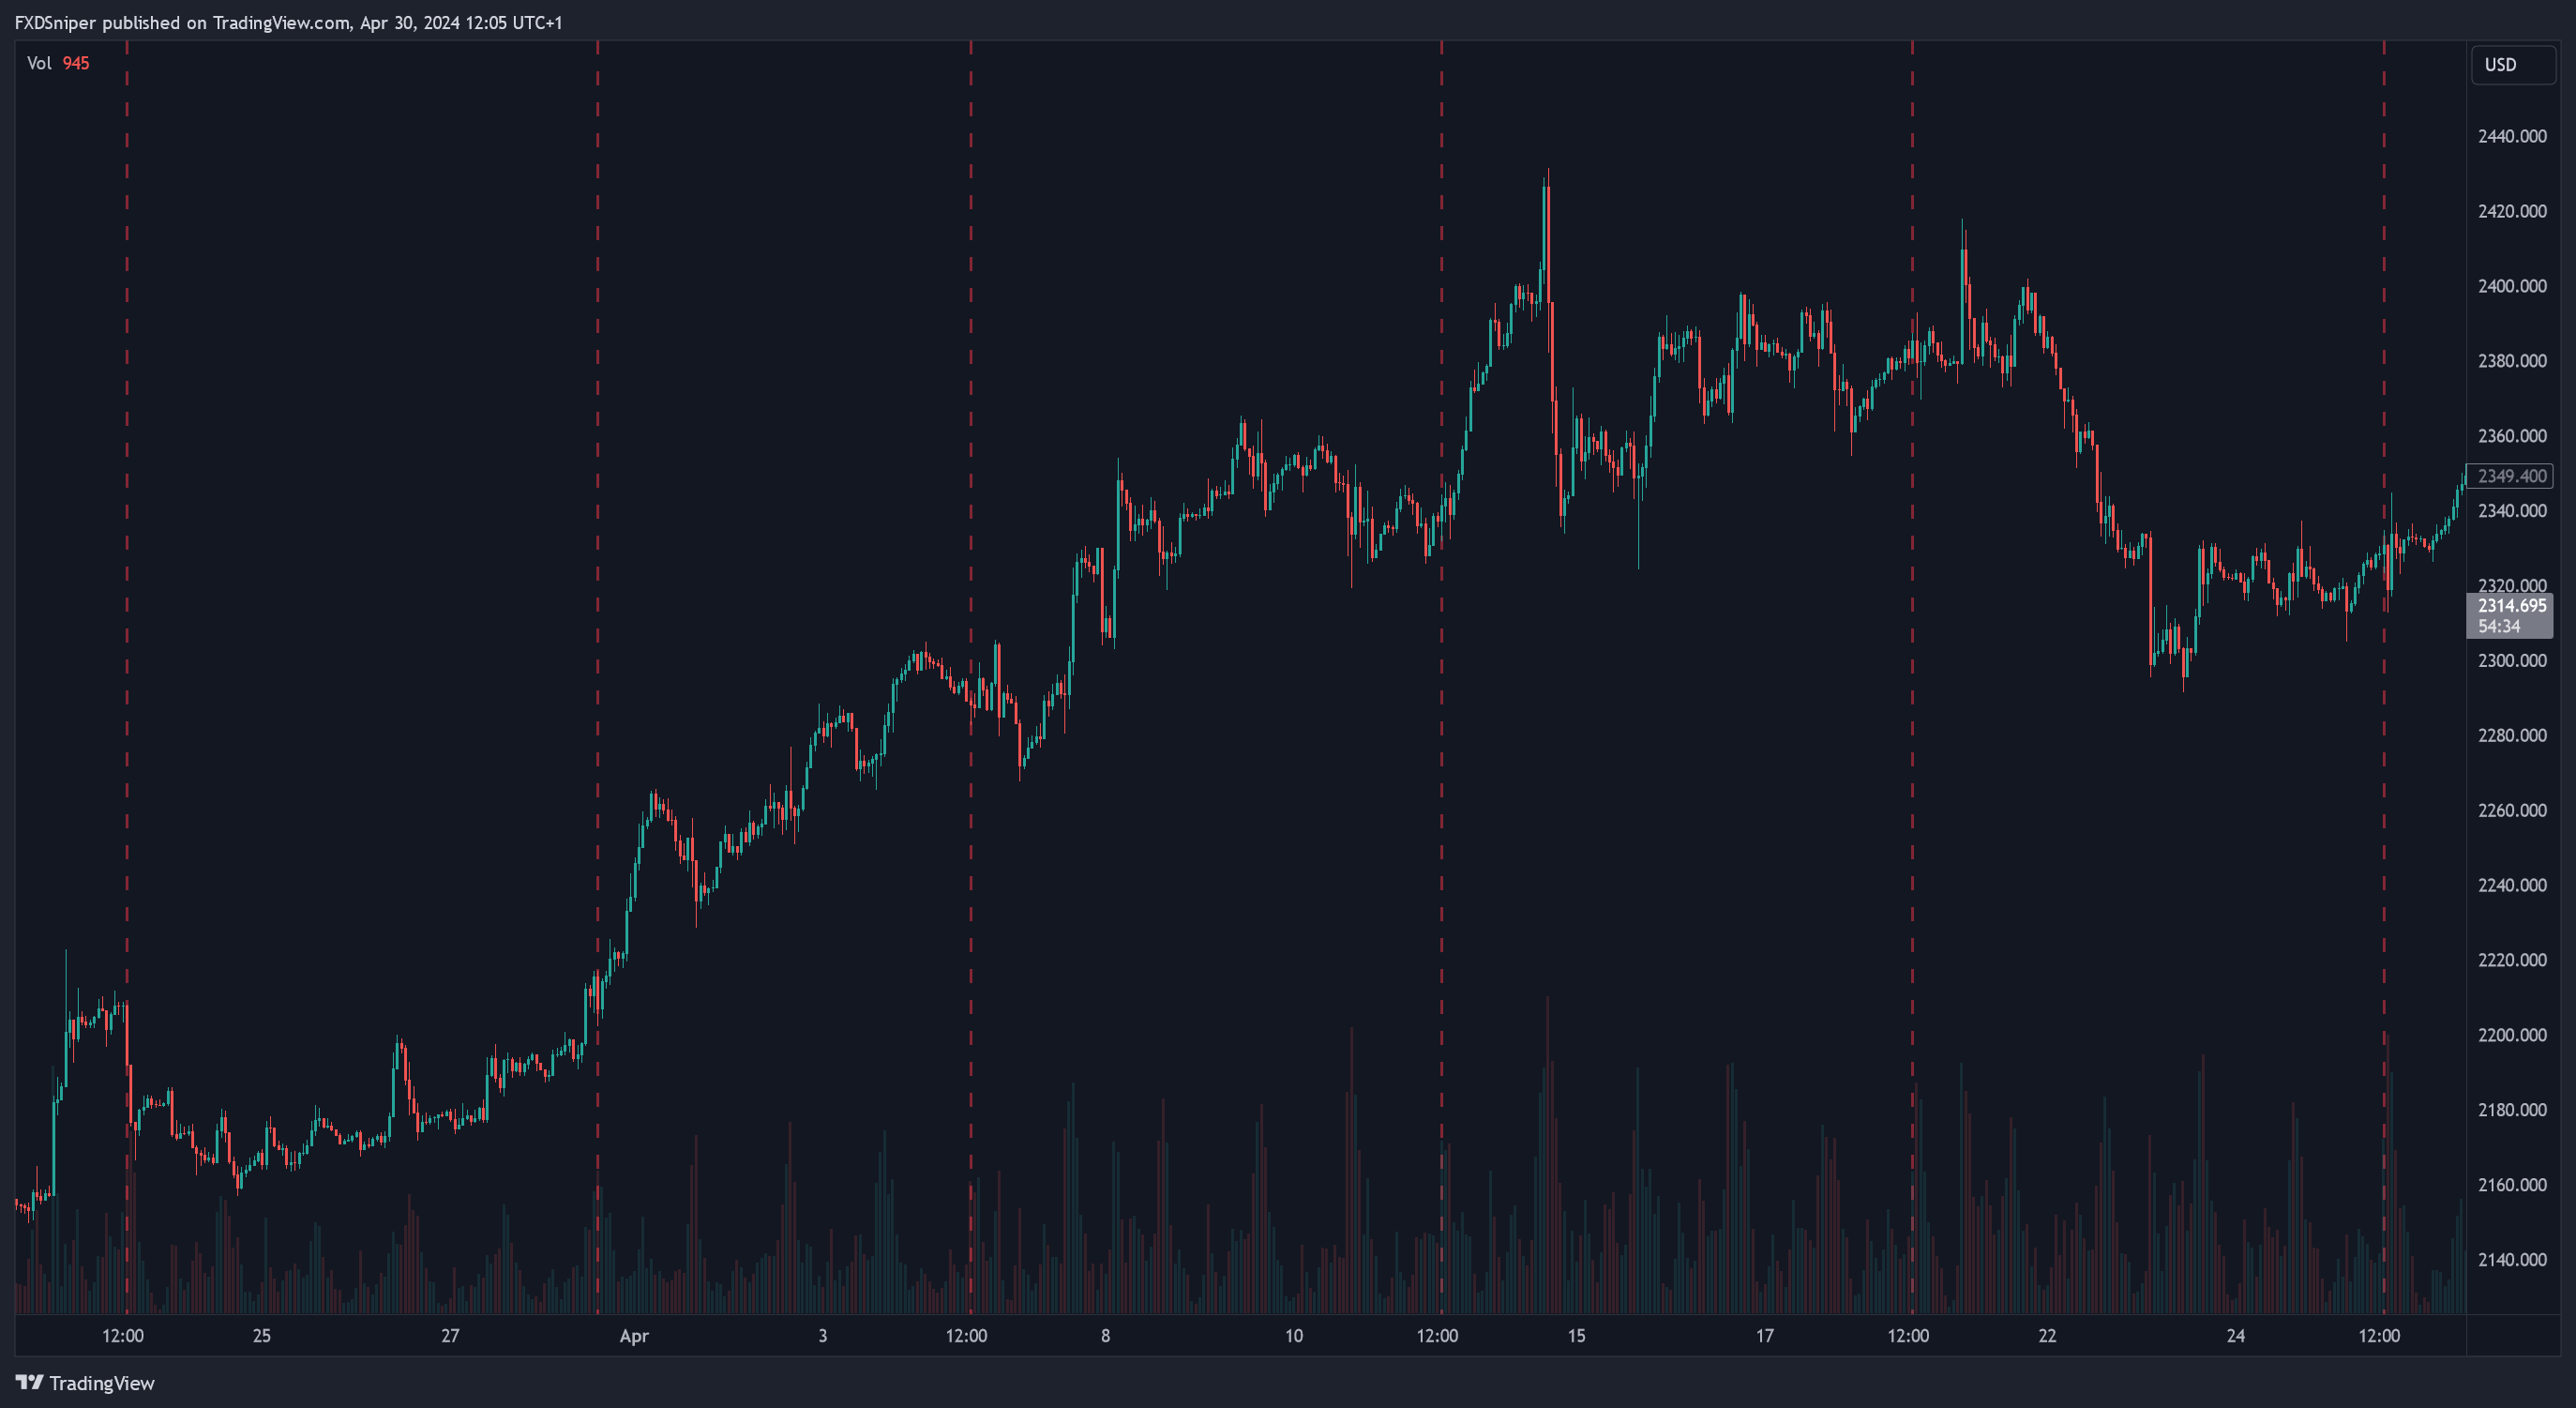
PPI
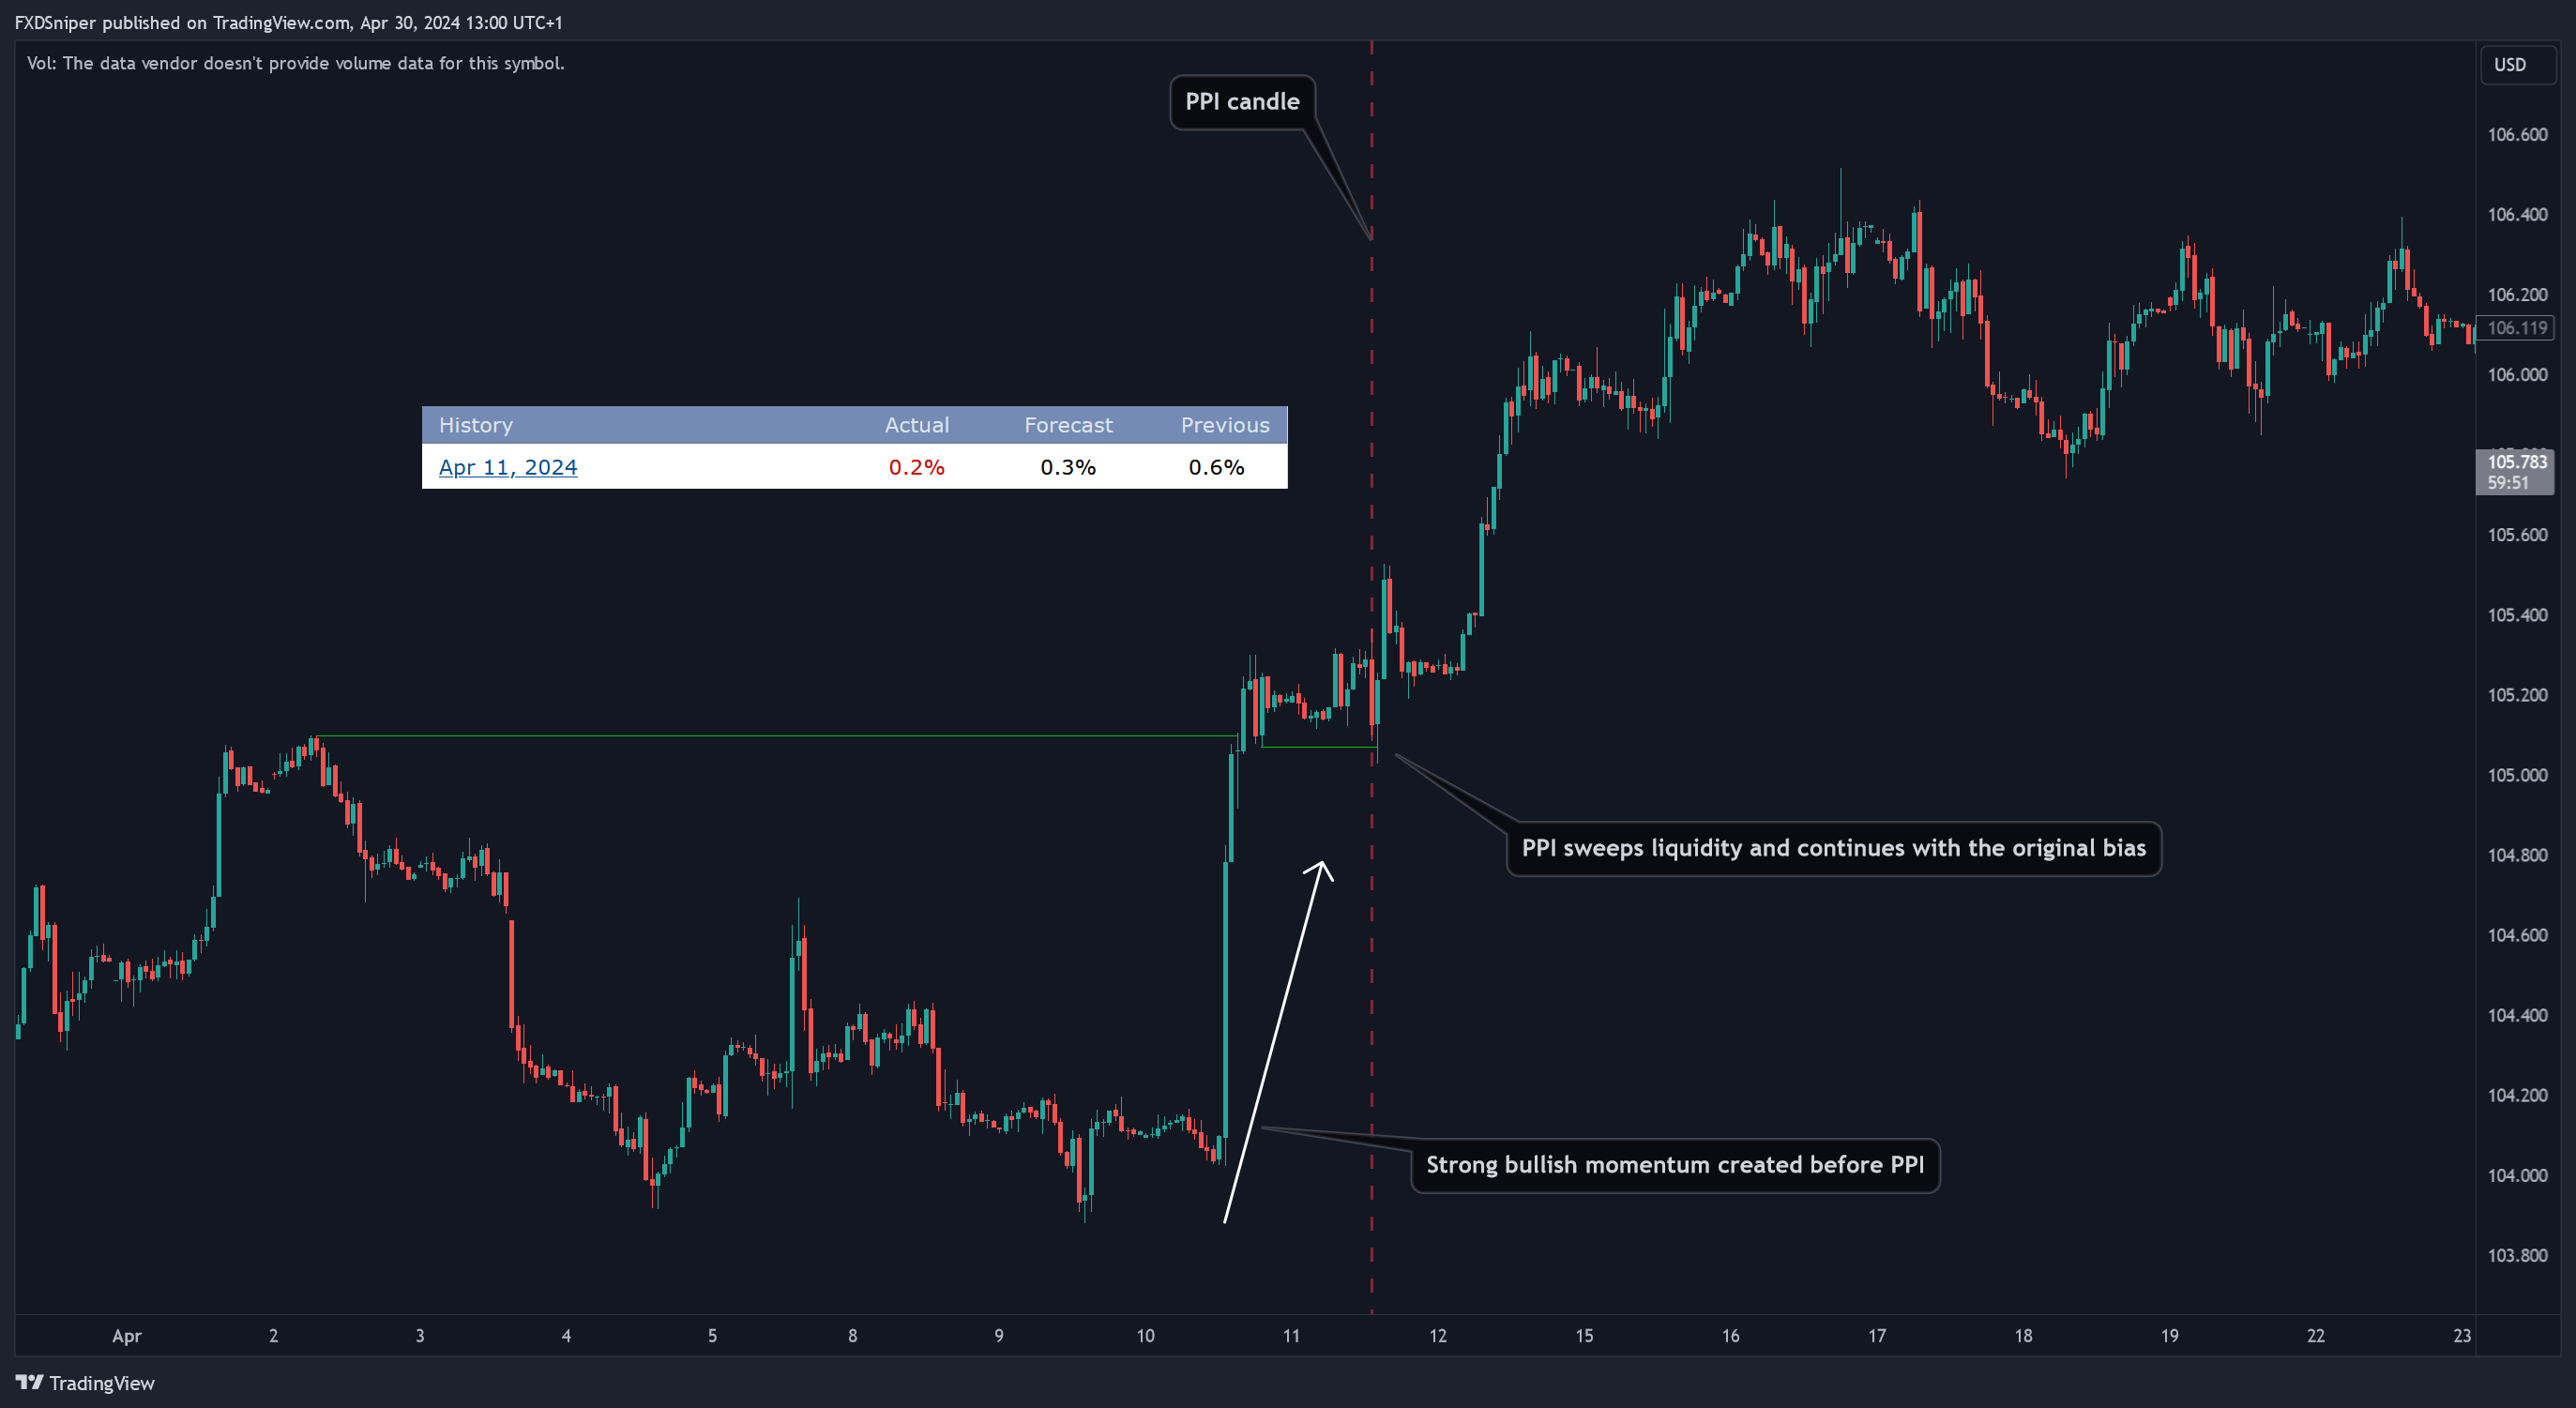
Again, we have two types of PPI. The regular PPI and Core PPI, both are released at the same time during the second full week of the month.
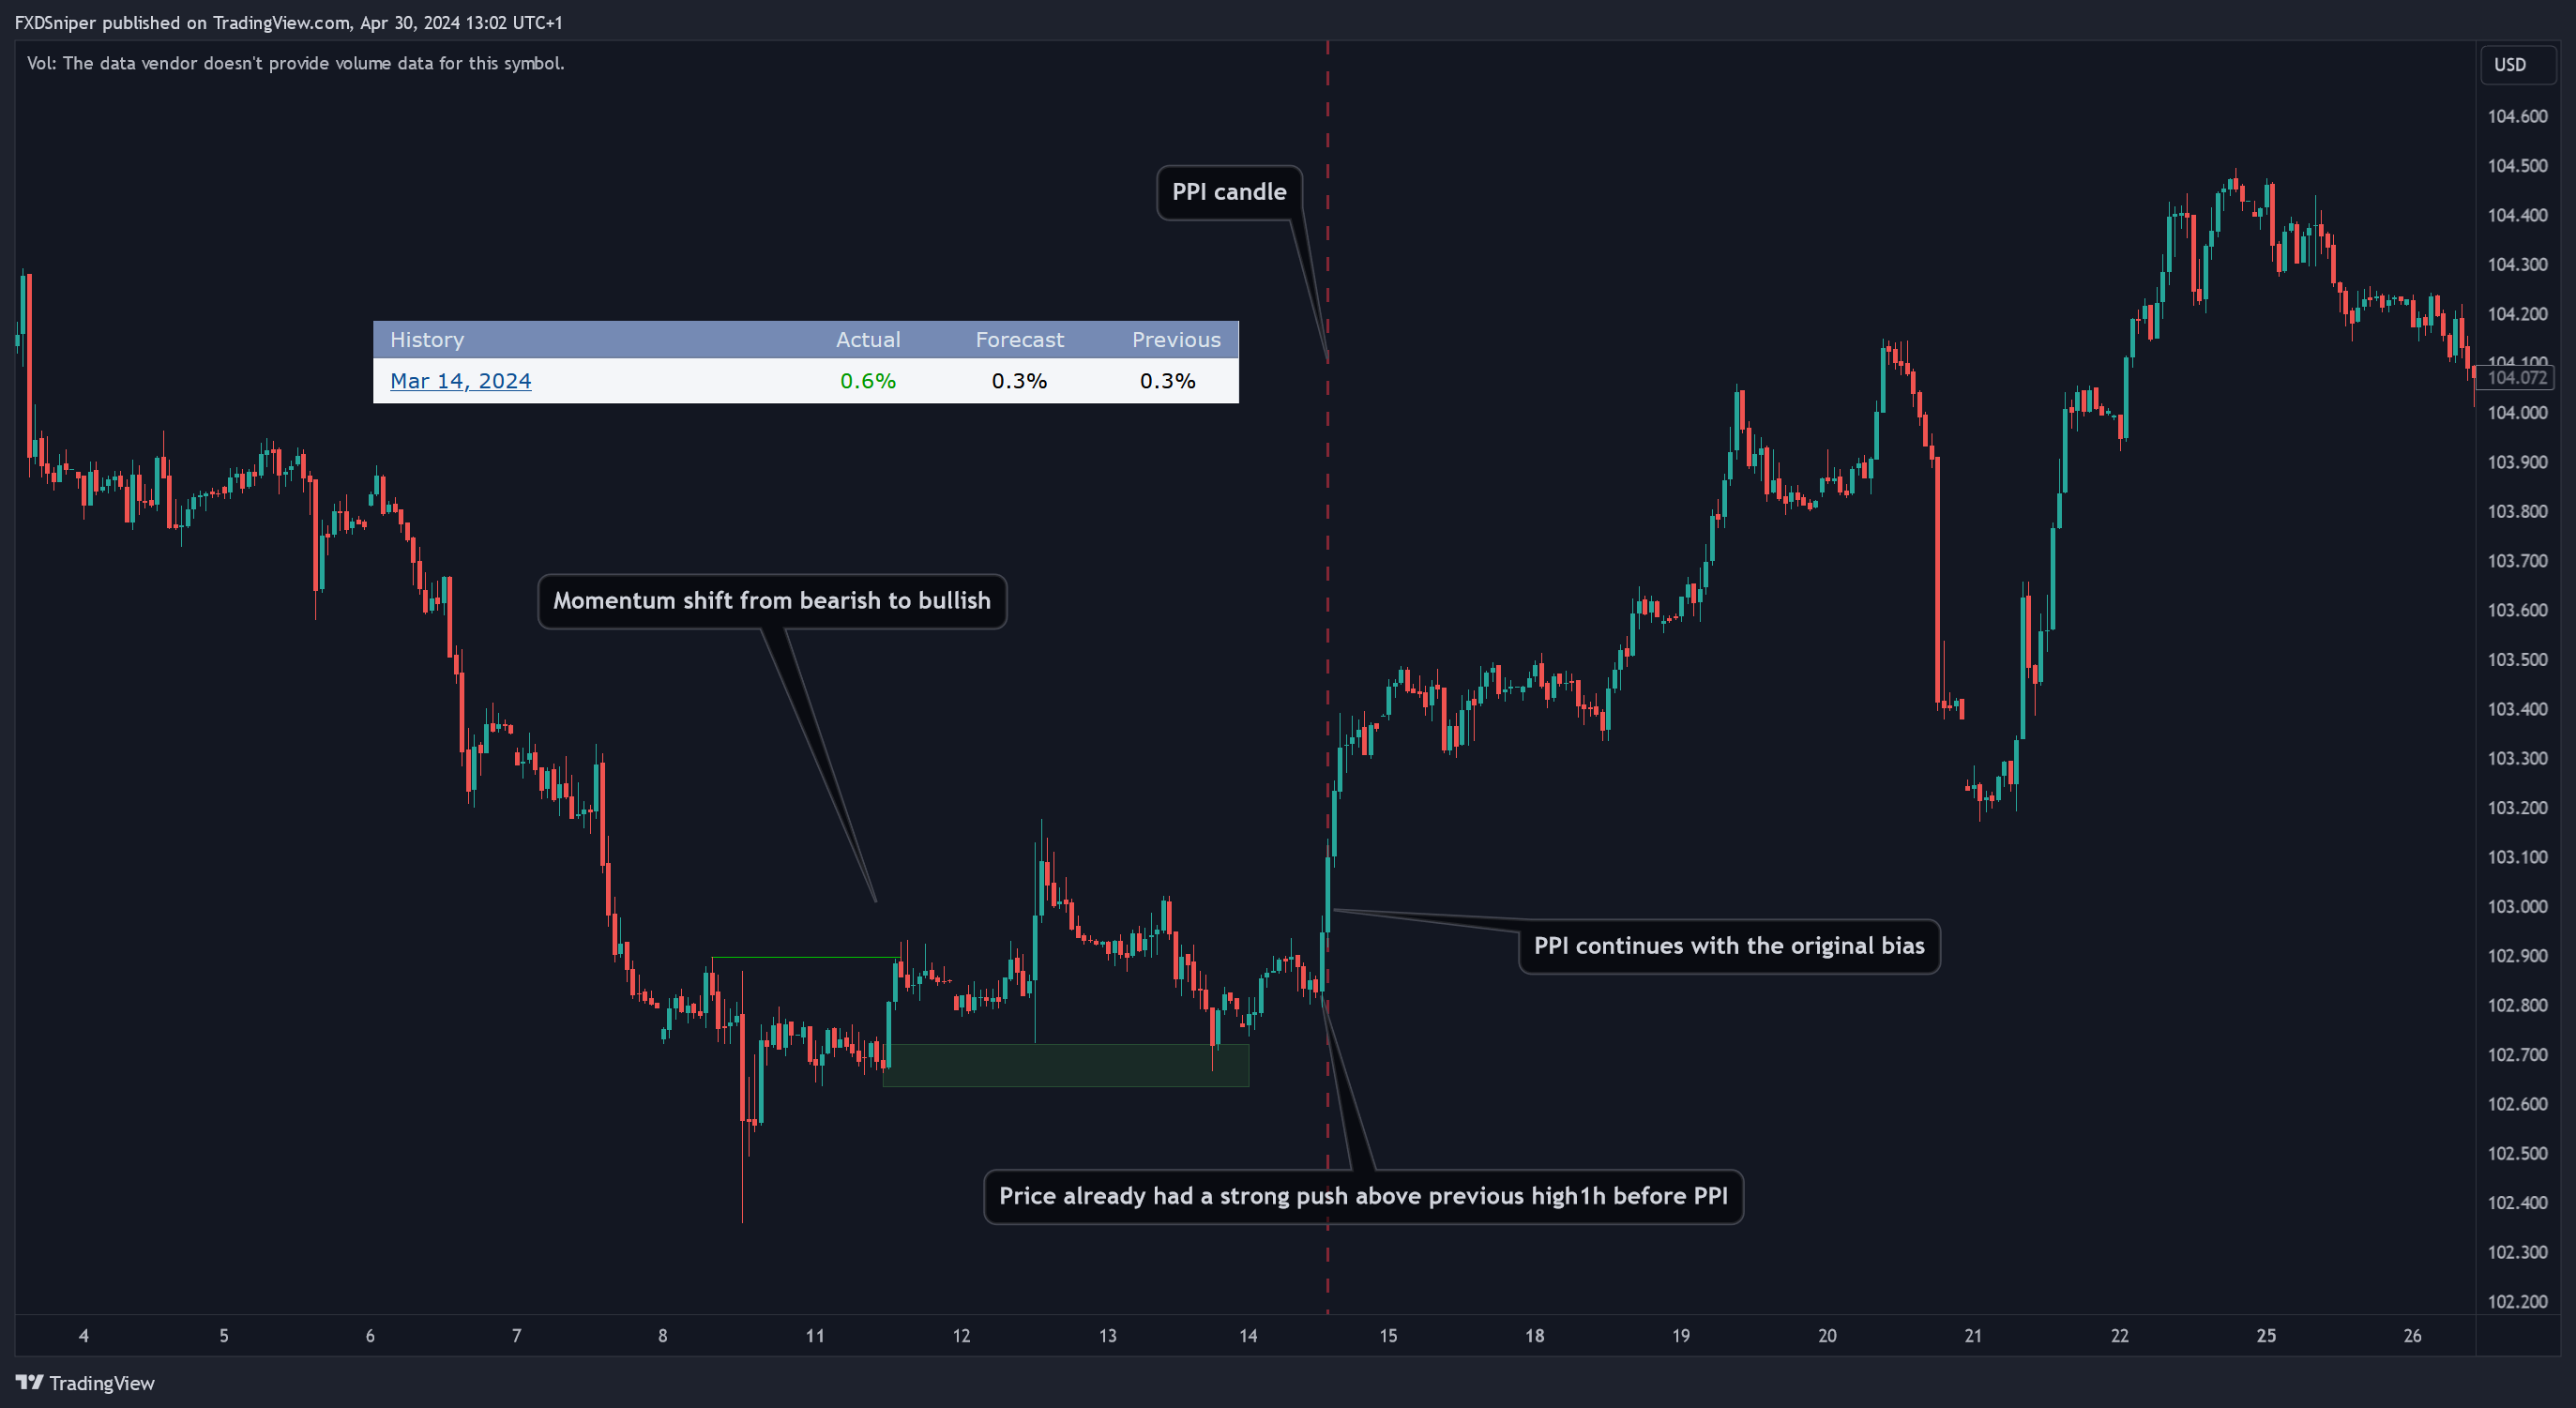
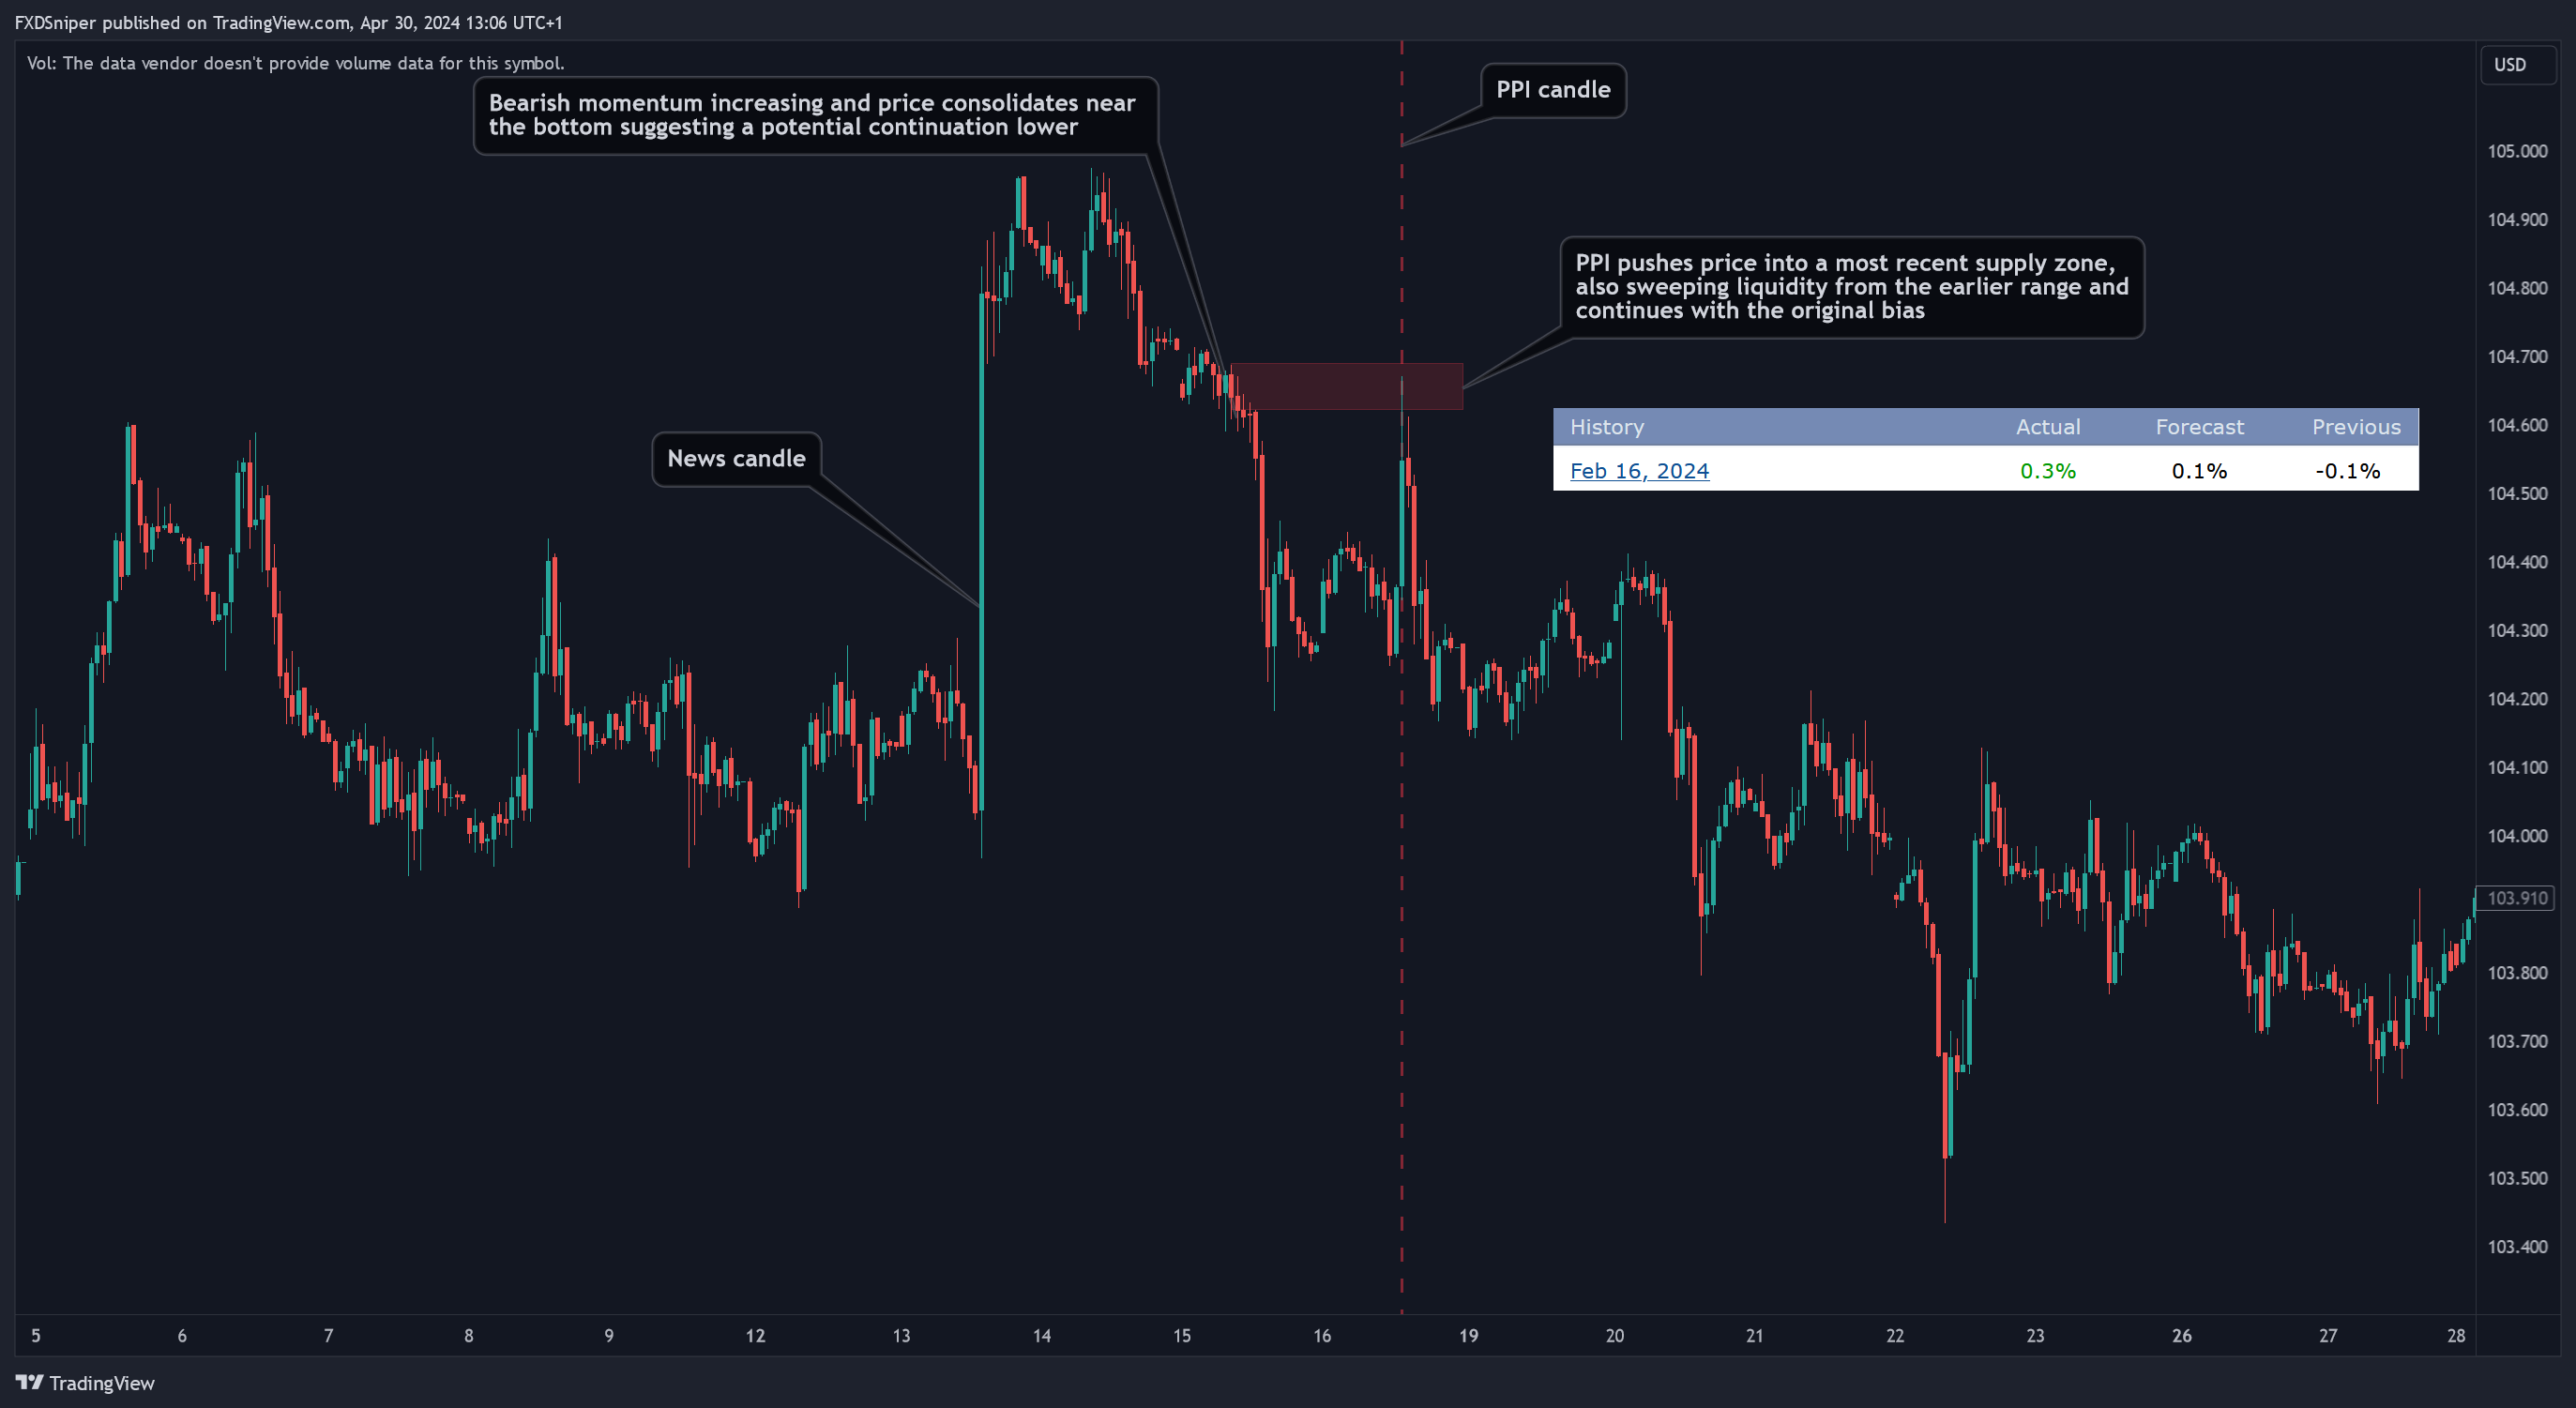
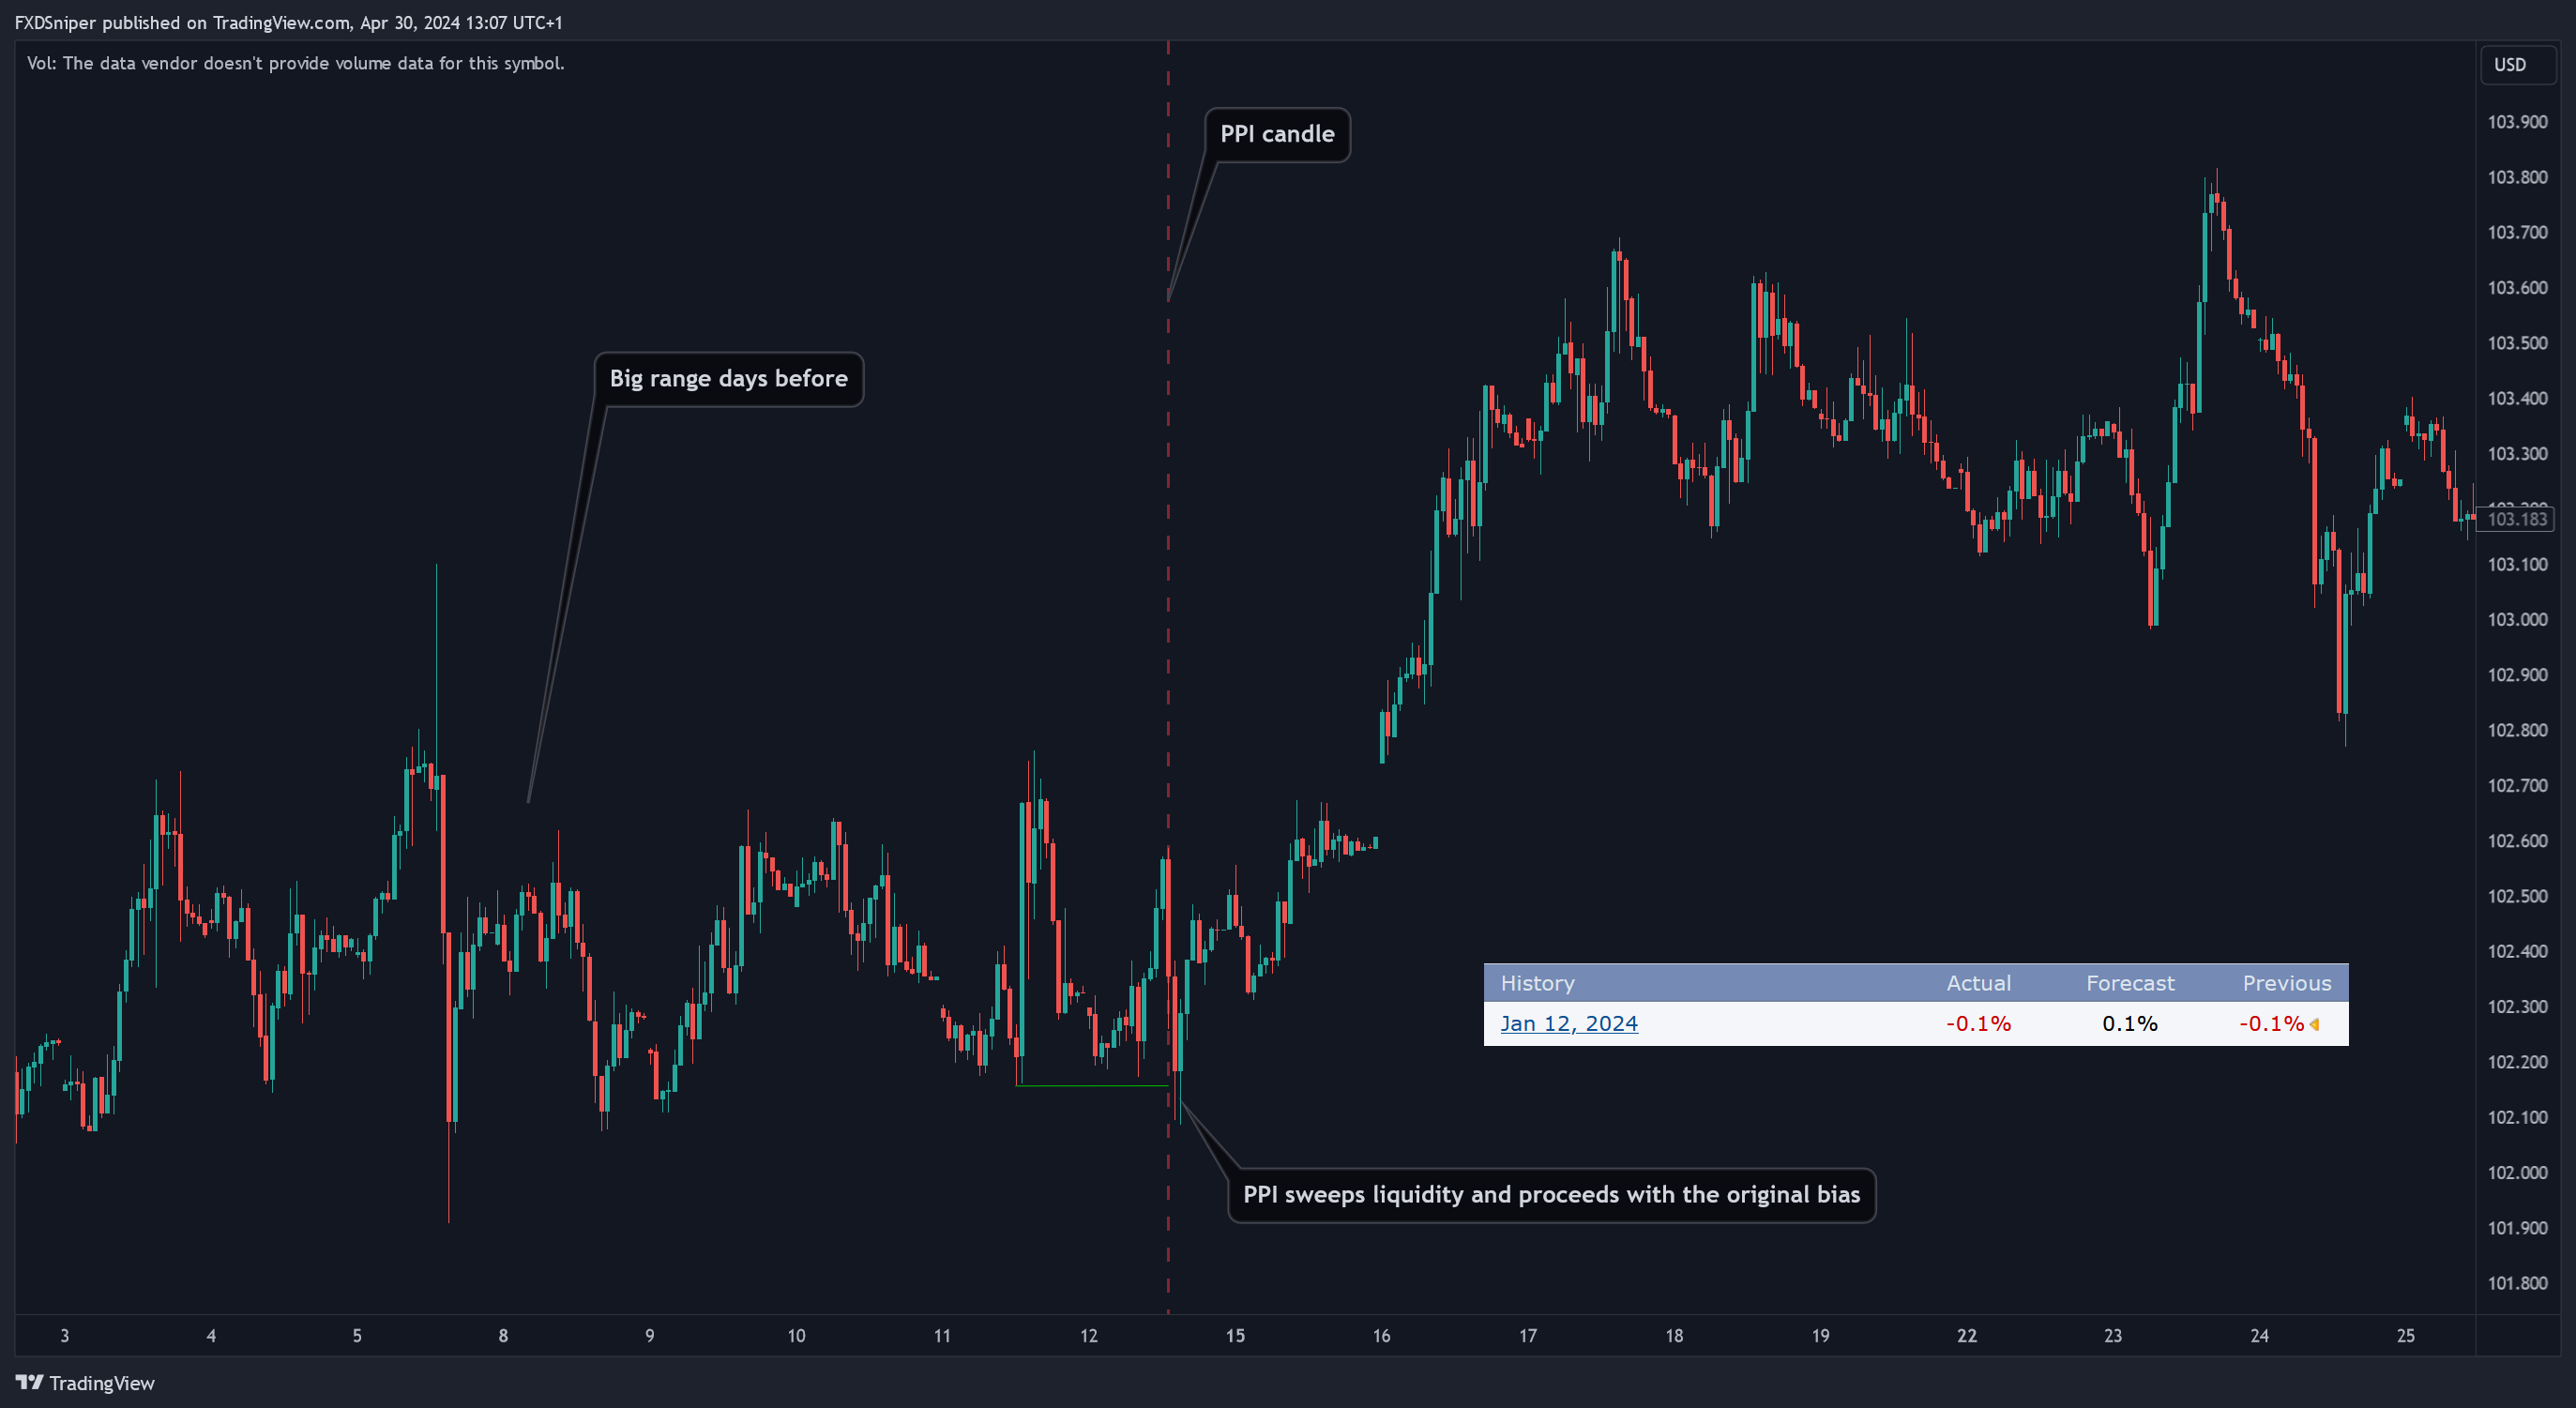
It’s a type of news related to the CPI. The difference is, one is a Consumer PI and the other is a Producer PI. So you can expect a similar type of behavior as during CPI, however PPI is a little bit less volatile and will usually continue with the original bias.
As you may have noticed, the outcome of the news didn’t really matter. Price simply continued with the original bias. If there was a range earlier, we saw a little sweep of liquidity but at the end, the original bias wins.
FOMC, Interest Rates and other political events
When it comes to these types of news everything depends on how the markets have behaved lately as a whole. I’m not going to show you any examples as it’s different every time and there’s no single pattern.
The overall idea is still the same, the charts will show you what’s most likely to happen but whether it will move one way during the news and reverse soon after or just go one way without stopping or do nothing, you just don’t know which one you’ll get until it happens. The charts will give you signs of where the money is going but because there’s no pattern to follow you have to be prepared for everything.
Some key things to note are:
If the price goes one way during the news release and stops within a small range and you notice huge volume bars. This suggests an accumulation so the price will either reverse soon or it will do a sweep and then reverse. If you’re feeling confident you can enter the trade as soon as you spot the accumulation. If not, you can wait for the range to be broken and enter as it’s being retested.
If the price shots one way and reverses soon after it may mean two things.
- If the news results were good, the price may come back to retest its initiation point. Like a break and retest pattern where you can enter during the retest.
- If the news were bad, mixed or unclear. This may have been a fake out and the price will reverse. Most likely if this happens you will see a choch style pattern where you can enter during a retest.
Also keep an eye on each structure point and recent supply/demand zones before and after the news. If they get tapped and rejected or broken, they will give you an idea what’s most likely to happen next.
This applies to all the news.
I know this guide is called “How to trade the news” but the goal here is not to make you trade during the news. It’s to help you understand what’s going on before and after the news and to show you that they are predictable and you should not be afraid of trading during these times.
Good luck with your trading and don’t blow your accounts!
